The public sector has an opportunity to support the trucking industry’s sustainability goals through a variety of practices, including developing reasonable regulations, standards and incentives, supporting research and testing, and pursuing congestion mitigation.
Regulations, Standards and Incentives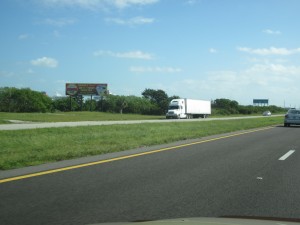
The trucking industry is subject to a number of federal, state and local policies, regulations, and incentives ranging from hazardous materials and emissions-related rules to driver’s Hours-of-Service and drug and alcohol testing regulations. Specifically related to sustainability are:
- Greenhouse Gas Emissions Standards and Fuel Efficiency Standards for Medium- and Heavy-Duty Engines and Vehicles (EPA and NHTSA)
- EPA’s Clean Trucks Plan
- Zero-Emission Charging Infrastructure
- Commercial Vehicle Size and Weight Limits (FHWA)
- Idling Limits (varies by state)
- Speed Limits (varies by state)
- SmartWay Program (EPA)
- Diesel Emissions Reduction Act (EPA)
- Sustainable Highways Initiative (FHWA)

Greenhouse Gas Emissions Standards and Fuel Efficiency Standards for Medium- and Heavy-Duty Engines and Vehicles
EPA collaborated with NHTSA to promulgate GHG emissions and fuel economy standards for heavy-duty trucks. These requirements set specific standards for engines as well as vehicles beginning in model year 2014.[1] As a result, model year 2017 trucks meeting the final standards were estimated to reduce GHG emissions and fuel consumption by as much as 20 percent compared to a model year 2010 truck. EPA and NHTSA project a lifetime fuel cost savings of $50 billion for vehicles built from model year 2014 to 2018.
A second phase of this program was enacted in 2016 which requires additional reductions in GHG emissions and fuel consumption.[2] Trucks meeting these standards, which will apply through model year 2027, will reduce GHG emissions and fuel consumption by as much as an additional 25 percent. In addition, newly established standards for the trailers pulled by these trucks will provide up to an additional 9 percent reduction by 2027. EPA and NHTSA project an additional lifetime fuel cost savings of $170 billion from these vehicles.
EPA proposed a third phase of HD GHG standards and intends to consider potential changes to certain HD GHG Phase 2 standards as part of a subsequent rulemaking for model year 2027 and later heavy-duty vehicles. This additional rulemaking will take into consideration recent Congressional action, such as the Inflation Reduction Act of 2022, that the Agency anticipates will lead to greater application of zero-emission vehicle technologies.
EPA’s Clean Trucks Plan
On December 20, 2022, the U.S. Environmental Protection Agency adopted a final rule, “Control of Air Pollution from New Motor Vehicles: Heavy-Duty Engine and Vehicle Standards,” that sets stronger emissions standards to further reduce air pollution from heavy-duty vehicles and engines starting in model year 2027.[3]
The final program includes new emission standards that are significantly more stringent and that cover a wider range of heavy-duty engine operating conditions compared to today’s standards; further, the final program requires these more stringent emissions standards to be met for a longer period of when these engines operate on the road. EPA estimates that the final rule will reduce NOx emissions from heavy-duty vehicles in 2040 by more than 40 percent; by 2045, a year by which most of the regulated fleet will have turned over, heavy-duty NOX emissions will be almost 50 percent lower.
Zero-Emission Charging Infrastructure
Federal and state efforts to advance the use of zero-emission trucks, using electricity or hydrogen fuel cells, will require new infrastructure to charge or fill these vehicles. Large-scale infrastructure investments will be a necessary to expand the availability of this infrastructure. For example, an ATRI study found some states would need more than 50 percent of current electricity generation to meet travel needs if all classes of vehicles were converted to electric.[4] In addition, initial equipment and installation costs at the nation’s truck parking locations is estimated to top $35 billion. States will need to work with the trucking industry and private sector companies to evaluate, plan for and finance the deployment of this infrastructure.
Commercial Vehicle Size and Weight Limits
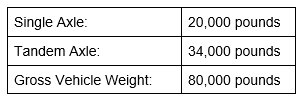
National weight standards apply to all commercial vehicles operating on the Interstate Highway System.[5] Table 3.1 shows the federal commercial vehicle maximum weight limits. States may set their own standards for state highways.
Table 3.1. Federal Commercial Vehicle Weight Limits
National length standards apply to all commercial vehicles operating on the “National Network” of highways. The National Network includes the Interstate System as well as other highways, formerly classified as “Primary System” routes, capable of safely handling larger commercial vehicles. The federal vehicle length limits are primarily minimums that states must allow. However, many states have maximum lengths for semitrailer and multi-trailer truck combinations that have been in place since the Intermodal Surface Transportation Efficiency Act (ISTEA) took effect on June 1, 1991.
The use of longer and/or heavier vehicle configurations represents an opportunity to meet sustainability goals. Trucking companies currently operate higher productivity vehicles (HPVs) where the option is available and they make operational sense. HPVs have been shown to improve fuel efficiency, as measured in ton-miles per gallon, from 20 percent to nearly 40 percent.[6] HPV use would likely expand if allowed in additional states due to the potential fuel savings and other efficiency improvements afforded by these configurations.
The use of alternative-fueled vehicles can increase the weight of a vehicle. Federal law allows trucks primarily powered by natural gas or electric battery to exceed federal weight limits by up to 2,000 pounds.[7] This allowance is supposed to offset the additional weight of alternative fueled vehicles resulting in no loss of cargo capacity. Electric trucks, however, can be even heavier and will likely need additional allowances to avoid adding more trucks to already congested roadways.[8]
Federal, and possibly state legislation, however, is a necessary component of allowing size and weight increases. Additionally, an extensive network of HPV roadways that allows carriers to operate throughout the country without having to decouple trailers or breakdown loads would likely increase adoption rates.
Idling Limits

While there are currently no federal standards, some states, cities and other municipalities limit vehicle idling within their jurisdictions. Currently, more than 60 states, counties or cities regulate the amount of time that a commercial vehicle may idle.[9] California has also adopted regulations that require additional emission controls while idling diesel engines, APUs and fuel-fired heaters.[10] To address the inconsistencies among the various idling regulations, the U.S. EPA developed a model idling law that states can use when adopting new or modifying existing rules.[11] Since drivers must maintain comfort while in their trucks, idling regulations need to be flexible enough to account for a variety of situations.
Research estimates that an idling tractor-semitrailer not only contributes to air and noise pollution, but consumes from 0.64 to 1.15 gallons of fuel per hour, depending upon the engine’s idling setting and load.[12] It has been estimated that large truck idling annually consumes 1 billion gallons of fuel during mandatory rest periods alone.[13] Consequently, idle reduction strategies are critical to reducing fuel use in the trucking industry. A number of national and state incentive programs have provided low- or no-cost loans, lease-to-own options, grants and tax credits to purchase idle reduction technologies. For example, the Wisconsin State Energy Office administered a Diesel Truck Idle Reduction Grant Program that provided 50 percent reimbursement for the purchase and installation of idling reduction equipment.[14]
Additionally, a 400-pound weight exemption for APUs was signed into federal law as part of the Energy Policy Act of 2005. This law allows an increase in the maximum gross vehicle weight limit when traveling on the Interstate System to compensate for the additional weight of an APU. This law does not preempt state statutes, however, and states are not compelled to enact the increased weight allowance. The 2012 federal surface transportation reauthorization law (MAP-21) allows states to increase this weight exemption to 550 pounds.[15]
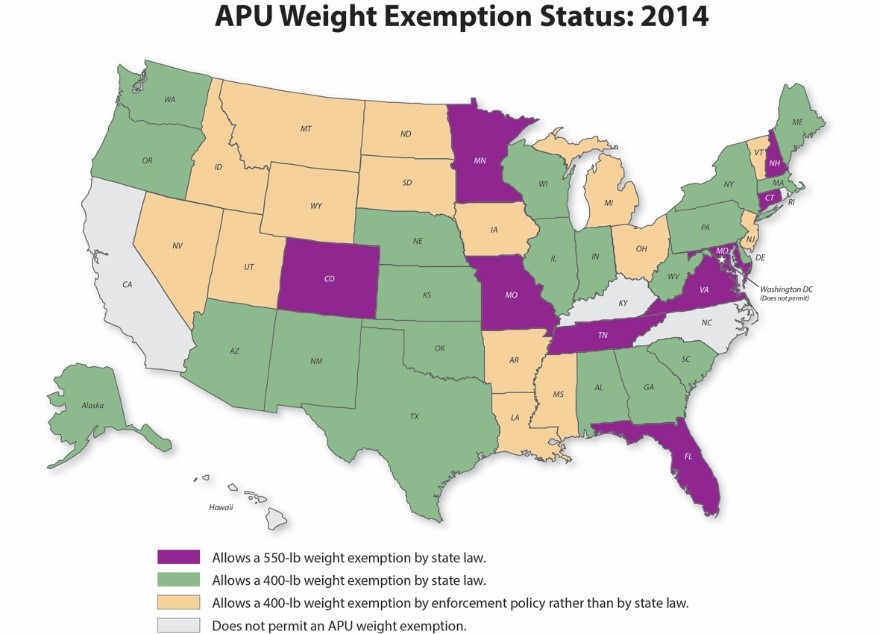
Figure 3.1. State Recognition of the Auxiliary Power Unit Weight Exemption to GVW Limit:
23 CFR 658.17(n)
Thus, in addition to states having different idling regulations, they also have different weight exemptions for a popular idle reduction technology. The public sector could further assist the trucking industry by implementing consistent (and reasonable) idling regulations and weight exemptions.
Speed Limits
The federal government first created a national maximum speed limit in 1974 in reaction to the oil crisis with the Middle East. The law prohibited states from setting speed limits above 55 miles per hour in an attempt to conserve fuel and reduce that nation’s dependence on foreign oil. The law was subsequently modified in 1987-88 to allow for a maximum posted speed of 65 mph on certain roadways and Congress ultimately repealed the law in 1995 which returned speed limit setting authority to the states. Currently, speed limits range from 55 mph on many urban interstates to 85 mph on certain rural, limited access interstates in Texas. In addition, a number of states have raised the speed limits for passenger vehicles while retaining a lower rate for trucks, thereby creating a differential speed limit. Increased speed variance on roadways often leads to increased vehicle interaction and accident exposure.

In addition to safety issues, speed limits play a critical role in vehicle fuel consumption. Several studies have shown that trucks consume more fuel when traveling at higher speeds. For example, increasing speeds from 55 to 75 mph can increase fuel consumption by 39 percent.[16] And while lower speeds do increase travel times, a change from 75 mph to 65 mph speed increases travel times just 15.5 percent. As a result, establishing reasonable speed limits which account for fuel savings is another important public sector practice in support of sustainability.
SmartWay Program
The U.S. EPA’s SmartWay Program is an example of an innovative, voluntary collaboration between the trucking industry, shippers and government. According to EPA, SmartWay partners have saved over 312 million barrels of fuel since 2004, which equates to $41.8 billion in fuel savings.[17] Partners in the program, which include freight carriers and shippers, commit to benchmark operations, track fuel consumption and improve performance annually. A testing, verification, and designation program to help freight companies identify equipment, technologies and strategies that save fuel and lower emissions is also a component. Even though the program has grown to more than 3,500 partners, federal funding has steadily decreased. Continued funding of this program at a sufficient level to maintain growth and expansion is another means of promoting sustainable practices among the trucking industry.
The U.S. EPA, SmartWay affiliates, a special federal advisory committee, and the Clean Air Act Advisory Committee collaborated to create a SmartWay “Vision 2020”.[18] Vision 2020 aims to lead the freight industry forward with fewer emissions, reduced fuel costs, greater energy independence, a healthier environment and energy independence.[19] The vision includes:
- Complete Coverage of the Transportation Supply Chain: Includes building an emission assessment and monitoring tool to cover all modes of freight transportation in hopes to streamline national freight data and amplify freight emission monitoring to a global scale. In addition to measuring emissions, Tool improvement research is ongoing to allow partners to measure additional pollutants data starting with black carbon.
- Sustainability Reporting: The EPA is working with the Global Reporting Initiative and the Carbon Disclosure Project to integrate carbon emissions data into guidelines and standards to specify emissions tracking from goods movement.
- Greater global collaboration: An increased contribution to the development of a Global Green Freight Action Plan, (developed by the United Nations Environment Program’s Climate and Clean Air Coalition).
- Information sharing: Information exchange and thought leadership are valued to meet the growing information needs of domestic and global freight partners.
Diesel Emissions Reduction Act
Since 2008, EPA has funded nearly 67,300 pieces of clean diesel technology through the Diesel Emissions Reduction Act (DERA).[20] These technologies include emissions and idle control devices, aerodynamic equipment, engine and vehicle replacements, and alternative fuel options. EPA awards these funds through competitive grants to a variety of entities including states, municipalities and certain non-governmental organizations. As of 2020 DERA was reauthorized under Division S- Innovation for the Environment section of the Consolidated Appropriations Act 2021 for up to $100 million annually through 2024.[21] This reauthorization helps to promote sustainable practices by advancing the latest generation of efficient, clean diesel technologies.
Sustainable Highways Initiative
Within the USDOT’s key goals laid out in their Strategic Plan for FY2018-2022 is an investment in infrastructure mobility and accessibility.[22] The sustainable highways initiative acts on this goal by working with Metropolitan Planning Organizations to ensure the longevity and resilience of US highways. FHWA created a Sustainable Pavements Program as well as the INVEST self-evaluation tool, which identifies characteristics of sustainable highways and provides information to help agencies and organizations integrate sustainability best practices into infrastructure projects.[23] [Back to top]
Research and Testing
In addition to regulations, standards and incentives, the government has the unique ability to support and fund independent research. Public sector research and development (R&D) funds are often needed to encourage advances in technology since the speculative cost can often outweigh the benefits to a private sector entrepreneur, regardless of the benefits to society as a whole. Several R&D opportunities exist for concepts such as engine or fuel modifications, dedicated truck lanes and truck platooning.
New Engine or Fuel Modifications
The federal government has been funding and coordinating research to improve engine performance since the oil crisis of the 1970s. The public sector has played an important role in advancing a number of design features, including advanced fuel-injection systems, exhaust after-treatments and diesel particulate filters. According to a report by the American Energy Innovation Council, the federal government’s $1 billion investment in diesel engine R&D from 1986 through 2007 generated over $70 billion in economic benefits.[24]
The Department of Energy (DOE) Office of Energy Efficiency and Renewable Energy has actively pursued increased efficiency goals. The DOE and its public, private and academic partners are working in the areas of low temperature combustion, dilute (or lean-burn) gasoline combustion , and clean burning diesel combustion.[25] The emerging research is compatible with the industry trend toward engine downsizing and boosting to improve vehicle fuel economy.
Dedicated Truck Lanes
During the past decade, interest in dedicated truck lanes (DTLs) has been increasing. DTLs separate truck traffic from passenger vehicles and could improve highway safety, increase efficiency and reduce congestion. Indiana, Illinois, Missouri and Ohio evaluated the economic feasibility of adding four DTLs (two in each direction) to the I-70 corridor running through those four states.[26] The analysis considered the impacts of:
- Spending on operation and maintenance;
- Travel changes such as speed, reliability and safety;
- Different financing options.
The researchers estimated an economic benefit of $36 billion over 20 years for the counties adjacent to the corridor across the four states and 258,000 job-years of additional employment from 2015 through 2030. Additional research and pilot projects on DTLs could further quantify potential efficiency gains and safety improvements.
Truck Platooning
Truck platooning uses driver assistive technologies to allow two or more trucks to wirelessly share data in order to closely follow a lead truck. These technologies allow the trucks to drive very close together which significantly decreases aerodynamic drag and improves fuel efficiency. Several truck platooning feasibility studies have been completed. Research conducted by Auburn University and ATRI investigated the partial automation of a two-truck platoon through the integration of vehicle-to-vehicle communications and adaptive cruise control.[27] This research found up to 10 percent improved fuel economy for the trailing truck and up to 5 percent improvement for the leading truck. A field test of a two-truck platoon conducted by the National Renewable Energy Laboratory found similar results.[28] A project at Aachen University in Germany successfully operated a platoon of four trucks spaced at 33-foot intervals and researchers at the University of California, Berkeley successfully operated several three-truck caravans at approximately 14-foot intervals.[29],[30] By using methods such as truck platooning, lane capacity may be increased by 65 to 100 percent.[31] The continued funding for this and other technology R&D is an important role the public sector can play in advancing sustainable practices among the trucking industry.
[Back to top]
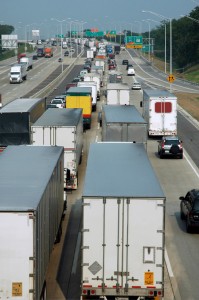
Congestion Mitigation
Trucks operate more efficiently in free-flowing traffic than in congestion. A fully loaded tractor-semitrailer uses significantly more fuel while shifting through the gears to reach a free-flow highway speed than it does simply to maintain momentum. Transportation Research Board (TRB) research findings indicate a correlation between fuel consumption and the operating speed of large trucks, stating:
“…the effect of the increased transient behavior at low speeds is to raise the quantity of fuel consumed at low speeds. This is mainly due to the wasting of energy with service brakes and the associated need for propulsion energy during the next acceleration event. In addition, some powertrains are less efficient under transient operation than under steady operation.”[32]
Congested travel conditions are widespread throughout the U.S., especially in urban areas. The Federal Highway Administration (FHWA) measures recurring congestion on the National Highway System (NHS) for both passenger vehicles and truck traffic. These measurements indicate that peak travel period congestion, where average vehicle speed slows to below posted speed limits, occurred on 14,608 miles of highway in 2015 (see Figure 3.2).[33] Additionally, such congestion led to “stop-and-go” conditions on an additional 10,383 miles.
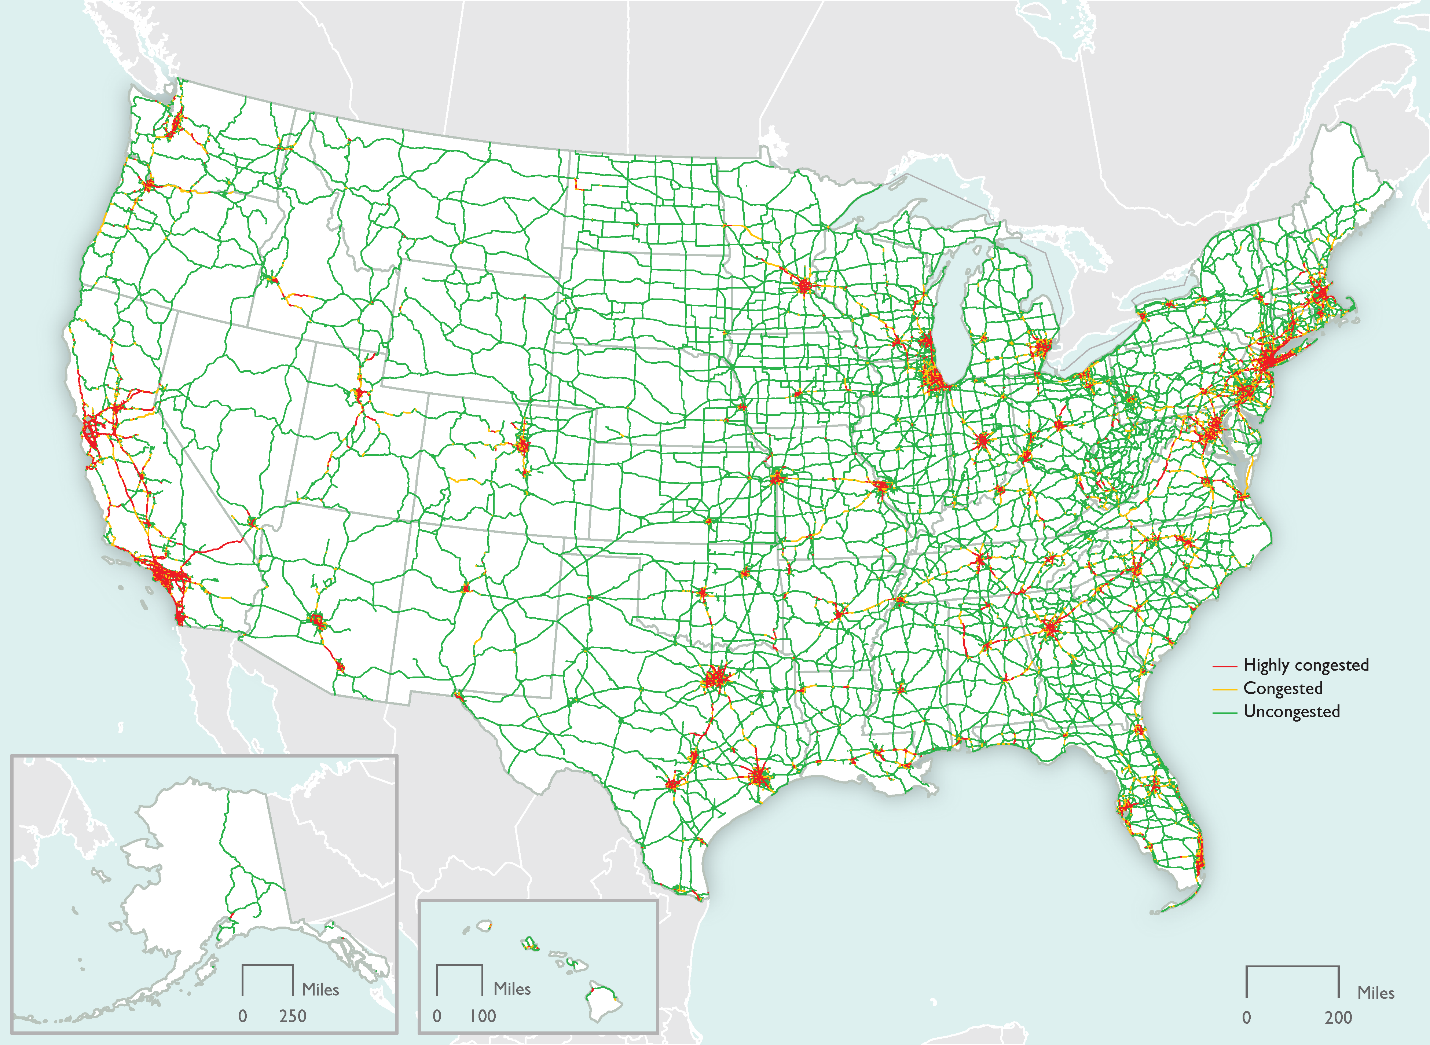
Figure 3.2. Peak-Period Congestion on the NHS, 2015
FHWA also estimated recurring peak-period congestion for the year 2045, assuming no increases in the network capacity. As shown in Figure 3.3, it was estimated that, due to increasing demand for the highway system, traffic will slow below the posted speed limit on 22,907 miles of the NHS and congested conditions will be present on an additional 55,795 miles.[34]
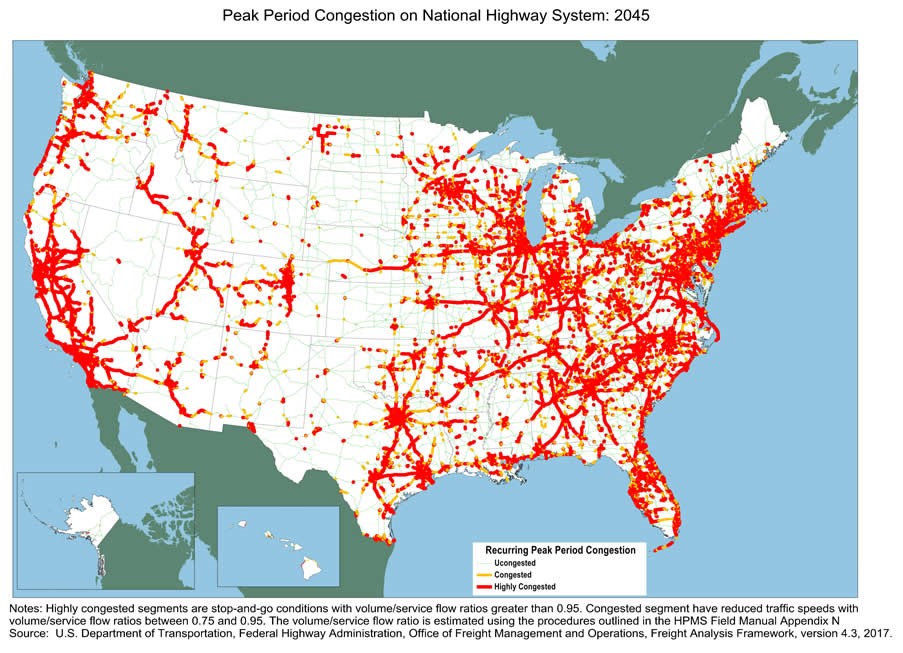
Figure 3.3. Estimated Peak-Period Congestion on the NHS, 2045
According to the recent ATRI report, Cost of Congestion to the Trucking Industry, delays of large trucks on the Interstate Highway System cost the industry more than $74.5 billion in 2016.[35] Additionally, when roadway conditions are not reliable, key “just in time” deliveries can be delayed, possibly impacting actions farther down the supply chain. Texas A&M’s Transportation Institute identifies several strategies, including infrastructure investment-related approaches to alleviating congestion, such as adding capacity to critical corridors through additional lane construction or constructing new streets and highways.[36]
An example of a state-level congestion cost measurement can be found in a Florida DOT study that utilized historical traffic density data (2003 – 2007) to quantify increased traffic congestion levels.[37] This study estimated that costs attributable to congestion ranged from approximately $5 billion in 2003 to nearly $7 billion in 2007 for Florida motorists. While the research did not specifically quantify the congestion costs for trucks, the authors noted that the increased levels of congestion directly contribute to higher shipping costs, delayed or missed deliveries, and increased inventories due to the unreliability of the transportation system.
An American Association of State Highway and Transportation Officials (AASHTO) report observed as early as 2010 that freight transportation is facing a “capacity crisis”.[38] In the report, it states that interstate traffic grew 150 percent from 1980 to 2006, while at the same time capacity increased only 15 percent. The report found that many current systems are at or near capacity and additional investments are required to maintain and improve infrastructure in order to meet anticipated demands.
Bottlenecks on major highways and urban interstate interchanges are also cited in the AASHTO report as a significant problem for the freight transportation system. Additionally, an annual report by ATRI has found that congested travel at many of the nation’s worst bottlenecks significantly hinders truck movements, and therefore fuel economy, with regular, recurring average vehicle speeds as low as 20 mph during AM and PM peak travel periods on the Interstate Highway System.[39]
One example of successful congestion mitigation is the southbound I-675 and I-75 interchange near Atlanta, GA. In early 2009, the Georgia DOT completed a project that added a lane at this location specifically to alleviate congestion. Using data from its Freight Performance Measures initiative, ATRI compared average speeds for the interchange from 2007 to 2020. The research found an average weekday PM peak-period speed of 25.3 mph in 2007 compared to 53.9 mph in 2020, a 85 percent increase.
To address the significant congestion problem, the National Surface Transportation Policy and Revenue Study Commission recommended in its Transportation for Tomorrow report that a “distinct program be established to fund projects that reduce congestion in [the] largest metropolitan areas.”[40] Additionally, the study found that the capital investment levels required to improve key highway conditions and performance measures through 2055 would average between $185 and $276 billion annually (in 2006 dollars). Such investment levels would constitute a significant increase in spending over the annual $68 billion funding level at the time of the report.
The FAST (Fixing America’s Surface Transportation) Act and its predecessor, MAP-21 (Moving Ahead for Progress in the 21st Century), attempted to address some of these issues by establishing a national policy to improve freight movement in the U.S.[41],[42] The bills included a number of provisions that identify freight-significant highway bottlenecks, improve the national freight network performance and support investment in freight-related surface transportation projects.
MAP21 also contains a provision for a congestion management process (CMP). CMPs are a systematic approach for managing congestion and provides strategies for congestion management which meets local and state needs. CMPs are required for metropolitan areas with populations exceeding 200,000 known as Transportation Management Areas (TMAs). Federal law requires that in all TMAs CMPs should be developed and implemented in the metropolitan transportation planning process, however there are not clear guidelines onto how methods and approaches are dictated.[43]
Public sector action is the key to reducing congestion in support of advancing sustainable practices. Identifying areas where freight congestion is most significant in order to prioritize congestion mitigation efforts is an important first step. Using this information to perform cost-benefit assessments which take into account fuel savings and efficiency benefits can further help to prioritize these investments. And finally, identifying adequate levels of funding to support these investments are all public sector practices that can support sustainability goals.
[Back to top]
[1] U.S. Environmental Protection Agency. (September 15, 2011). “Final Rulemaking: Greenhouse Gas Emissions Standards and Fuel Efficiency Standards for Medium- and Heavy-Duty Engines and Vehicles.” Available online: https://www.epa.gov/regulations-emissions-vehicles-and-engines/final-rule-phase-1-greenhouse-gas-emissions-standards-and
[2] U.S. Environmental Protection Agency. (October 2016). “Final Rule for Greenhouse Gas Emissions Standards and Fuel Efficiency Standards for Medium- and Heavy-Duty Engines and Vehicles – Phase 2.” Available online: https://www.epa.gov/regulations-emissions-vehicles-and-engines/final-rule-phase-2-greenhouse-gas-emissions-standards
[3] U.S. Environmental Protection Agency. (December 2023). “Control of Air Pollution from New Motor Vehicles: Heavy-Duty Engine and Vehicle Standards, Final Rule”, https://www.epa.gov/regulations-emissions-vehicles-and-engines/final-rule-and-related-materials-control-air-pollution.
[4] Jeffrey Short, Alexandra Shirk, and Alexa Pupillo, Charging Infrastructure Challenges for the U.S. Electric Vehicle Fleet, American Transportation Research Institute (December 2022), https://truckingresearch.org/2022/12/06/new-atri-research-evaluates-charging-infrastructure-challenges-for-the-u-s-electric-vehicle-fleet/.
[5] Federal Highway Administration. (February 1, 2017). “Federal Size Regulations for Commercial Vehicles.” Available online: https://ops.fhwa.dot.gov/freight/publications/size_regs_final_rpt/index.htm
[6] American Transportation Research Institute. (March 2008) “Energy and Emissions Impact of Operating Higher Productivity Vehicles, Update: 2008.” Available online: https://truckingresearch.org/2008/03/26/energy-and-emissions-impacts-of-operating-higher-productivity-vehicles/
[7] 23 U.S. Code § 127(s)
[8] Jeffrey Short, Alexandra Shirk, and Alexa Pupillo, Charging Infrastructure Challenges for the U.S. Electric Vehicle Fleet, American Transportation Research Institute (December 2022), https://truckingresearch.org/2022/12/06/new-atri-research-evaluates-charging-infrastructure-challenges-for-the-u-s-electric-vehicle-fleet/.
[9] American Transportation Research Institute. (2021) “Compendium of Idling Regulations.” Available online: https://truckingresearch.org/2020/03/16/idling-regulations-compendium/
[10] California Environmental Protection Agency. “Heavy-Duty Vehicle Idling Information.” Air Resources Board. Available online: https://ww2.arb.ca.gov/capp-resource-center/heavy-duty-diesel-vehicle-idling-information
[11] U.S. Environmental Protection Agency. (April 2006). “Model State Idling Law.” Office of Transportation and Air Quality.
[12] Argonne National Laboratory. “Vehicle Idle Reduction Savings Calculator.” Available online: https://www.anl.gov/es/reference/vehicle-idle-reduction-savings-worksheet-pdf
[13] Argonne National Laboratory. (August 2015). “Long-Haul Truck Idling Burns Up Profits.” Available online: https://afdc.energy.gov/files/u/publication/hdv_idling_2015.pdf
[14] Wisconsin State Energy Office. “Diesel Truck Idling Reduction Grant Program.” Available online: https://doa.wi.gov/Pages/LocalGovtsGrants/Diesel_Truck_Idling_Reduction_Grant_Program.aspx
[14] U.S. Department of Energy, Office of Energy Efficiency and Renewable Energy. “Idle Reduction Weight Exemption.”
[16] Bridgestone Firestone, North America Tire, LLC. (2008). “Real Questions, Real Answers: Tires and Truck Fuel Economy.” Available online: http://pressureguard.com/wp-content/uploads/2015/08/Tires_and_Truck_Fuel_Economy-BRIDGESTONE.pdf
[17] U.S. Environmental Protection Agency. (January 2021). “Fast Facts About SmartWay Transport Partnership.” Available online: https://www.epa.gov/smartway/smartway-program-successes.
[18] U.S. Environmental Protection Agency. “Vision 2020: A new Era of Freight Sustainability”. SmartWay. Available online: https://nepis.epa.gov/Exe/ZyPDF.cgi/P100VD9D.PDF?Dockey=P100VD9D.PDF
[19] U.S. Environmental Protection Agency. “How SmartWay Advances Sustainable Transportation Supply Chains.” Available online: https://www.epa.gov/smartway/how-smartway-advances-sustainable-transportation-supply-chains
[20] U.S. Environmental Protection Agency. (July 2019). “DERA Fourth Report to Congress: Highlights from the Diesel Emissions Reduction Program.” Available online: https://www.epa.gov/sites/default/files/2019-07/documents/420r19005.pdf
[21] U.S. Environmental Protection Agency. “Learn About Impacts of Diesel Exhaust and the Diesel Emissions Reduction Act (DERA)”. Available online: https://www.epa.gov/dera/learn-about-impacts-diesel-exhaust-and-diesel-emissions-reduction-act-dera
[22] U.S. Department of Transportation. “DOT Strategic Plan.” Available online: https://www.transportation.gov/dot-strategic-plan
[23] U.S. Department of Transportation. “Sustainable Highways Initiative.” Federal Highway Administration. Available online: https://www.sustainablehighways.dot.gov/overview.aspx#quest2
[24] Rissman, J. and K. Hallie. (2014). “Advanced Diesel Internal Combustion Engines.” American Energy Innovation Council. Available online: https://www.energy.gov/sites/prod/files/2016/03/f30/FY2015%20Advanced%20Combustion%20Engine%20R%26D%20Annual%20Report.pdf
[25] U.S. Department of Energy. “Advanced Combustion Strategies.” Office of Energy Efficiency and Renewable Energy. Available online: https://www.energy.gov/eere/vehicles/advanced-combustion-strategies
[26] TREDIS. “I-70 Dedicated Truck Lanes.” Available online: https://www.tredis.com/clients/43-x-case-studies/41-i-70-dedicated-truck-lanes
[27] Auburn University, et al. (April 2015). “Heavy Truck Cooperative Adaptive Cruise Control: Evaluation, Testing, and Stakeholder Engagement for Near Term Deployment: Phase One Final Report.” Available online: https://truckingresearch.org/2015/05/27/new-research-assesses-potential-for-driver-assistive-truck-platooning/
[28] National Renewable Energy Laboratory. “Truck Platooning Testing.” Available online: https://www.nrel.gov/transportation/fleettest-platooning.html
[29] Ramakers, R. et al. (2009). “Electronically Coupled Truck Platoons on German Highways.” Aachen University, Germany.
[30] SAE International, Ibid.
[31] Akerman et al., (2019). “Truck-Traffic on Highways for Sustainable, Safer and Higher Energy Efficient Freight Transport.” Technical Committee B.4 Freight Transport. World Road Association.
[32] National Research Council, Transportation Research Board, Committee to Assess Fuel Economy Technologies for Medium- and Heavy-Duty Vehicles. (2010). “Technologies and Approaches to Reducing the Fuel Consumption of Medium- and Heavy-Duty Vehicles.” Available online: https://www.nap.edu/catalog/12845/technologies-and-approaches-to-reducing-the-fuel-consumption-of-medium-and-heavy-duty-vehicles
[33] U.S. Department of Transportation, (Washington, DC: 2019). “Freight Facts and Figures.” Bureau of Transportation Statistics, Available online: https://www.bts.gov/product/freight-facts-and-figures
[34] Ibid
[35] Hooper, Alan. (2018). “Cost of Congestion to the Trucking Industry: 2018 Update.” American Transportation Research Institute. Available online: https://truckingresearch.org/2018/10/18/cost-of-congestion-to-the-trucking-industry-2018-update/
[36] Texas A& M Transportation Institute. “Mobility Investment Priorities – Strategies.” Available online: https://mobility.tamu.edu/mip/strategies.php
[37] Blanco, A.G., Steiner, R.L., Peng, Z. and Shmaltsuyev, M. (2010). “The Economic Cost of Traffic Congestion in Florida.” Florida Department of Transportation.
[38] American Association of Highway and Transportation Officials. (2010). “Unlocking Freight.” Available online: http://pahighwayinfo.org/wp-content/uploads/2010/07/FreightReportFinal_77101.pdf
[39] American Transportation Research Institute. “Top 100 Truck Bottlenecks – 2021” Available online: https://truckingresearch.org/2021/02/23/2021-top-truck-bottlenecks/
[40] National Surface Transportation Policy and Revenue Study Commission. (2007). “Transportation for Tomorrow.” Available online: https://rosap.ntl.bts.gov/view/dot/18125
[41] U.S. Department of Transportation. (2012). “MAP-21 Freight Significant Provisions.” Federal Highway Administration. Available online: https://www.fhwa.dot.gov/map21/factsheets/freight.cfm
[42] U.S. Department of Transportation. (2015). “Fixing America’s Surface Transportation Act.” Available online: https://www.fhwa.dot.gov/fastact/
[43] U.S. Department of Transportation. “Congestion Management Process.” Federal Highway Administration. Available online: https://ops.fhwa.dot.gov/plan4ops/focus_areas/cmp.htm