Alternative Powertrains | Cargo Management | Higher Productivity Vehicles

Truck manufacturers first began to develop more fuel efficient vehicles in the 1970s as a result of the energy crisis. Since that time, significant gains in efficiency have been made through improvements in aerodynamics, tire rolling resistance and engine performance. Manufacturers have enhanced tractor aerodynamics, for example, by streamlining the front profile and sloping the hood, utilizing aerodynamic bumpers and mirrors, and adding roof and side fairings. These changes have reduced the average drag coefficient (a measure of wind resistance) from 0.80 to 0.65 – a 20 percent improvement compared to more traditional tractor styling.[1] Other advances such as trailer aerodynamics, innovative cargo management systems and higher productivity vehicles also have the ability to improve fuel efficiency and reduce emissions.
Further efficiency improvements were mandated for medium- and heavy-duty vehicles manufactured in 2014 and beyond. The U.S. Environmental Protection Agency (EPA) and National Highway Traffic Safety Administration (NHTSA) issued a joint rulemaking in 2011 that specifies emissions and fuel consumption standardsfor truck-tractors, heavy-duty pickups and van and certain vocational vehicles.[2] Model year 2017 trucks meeting the final standards were estimated to reduce GHG emissions and fuel consumption by as much as 20 percent compared to a model year 2010 truck.
A second phase of this program was enacted in 2016 which requires additional reductions in GHG emissions and fuel consumption.[3] Trucks meeting these standards, which will apply through model year 2027, will reduce GHG emissions and fuel consumption by as much as an additional 25 percent. Newly established standards for the trailers pulled by these trucks are estimated to provide an additional 9 percent reduction by 2027.
Since the announcement of the Phase 2 regulations, manufacturers have been updating their test procedures to ensure they will be compatible with requirements which began with the 2021 year model. In doing so, areas of improvement were identified where the regulations could be improved, thus, in 2021, EPA finalized changes to the test procedures as well as other amendments.[4]
On August 5, 2021, EPA released a statement concerning the Clean Trucks Plan which states that by December 2022 they will propose and finalize new emission standards to reduce nitrogen oxides (NOx) pollution from trucks beginning in the model year 2027.[5] EPA will also be exploring new GHG emission standards for heavy-duty engines beginning with the model year 2030.
Tractor Aerodynamics
Truck tractors have become increasingly more aerodynamic with manufacturers analyzing design aspects ranging from windshield angles to sun visor shapes in an effort to improve efficiency. Several devices are currently available for improving tractor aerodynamics including roof fairings, gap reducers, aerodynamic bumpers and mirrors and fuel tank side fairings (see Figure 2.1).
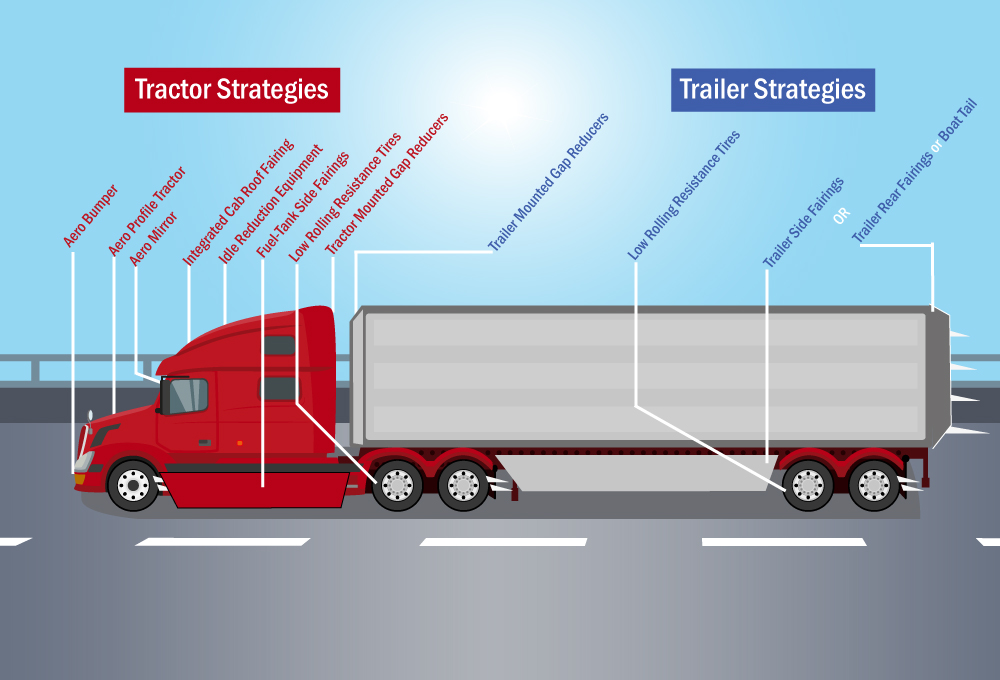
Figure 2.1. Currently Available Aerodynamic Devices
Many of these devices are available as options on new tractor purchases or can be retrofitted on existing tractors. According to the National Academy of Sciences, a roof fairing can reduce fuel consumption by 7 to 10 percent at a cost of $500 to $1,000 per unit while a gap reducer may decrease fuel consumption by 2 to 3 percent at a cost of $300 to $500.[6] A separate study found that traditional mirror designs account for 4.5 percent of the total vehicle drag while aerodynamic mirrors account for only 1.5 to 2.5 percent.[7] Switching from the traditional mirror design to the aerodynamic option resulted in a 1 percent improvement in fuel economy.[8]
[Back to top]
Trailer Aerodynamics
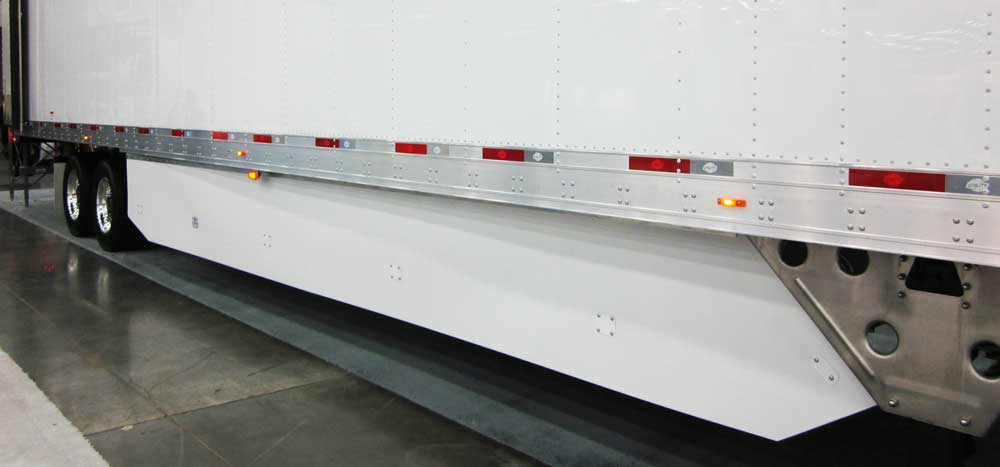
While significant fuel efficiency improvements can be made through increasing tractor aerodynamics, changes made to the trailer can yield additional gains. EPA’s SmartWay Partnership, for example, has researched the impact of several trailer modifications, including side fairings (also known as a “skirts”), which are attached to the lower edge of each trailer side between the axles and trailer tails (also known as “boat tails” or “base flaps”) which are attached to the rear door of the trailer (refer to Figure 2.1).
Trailer side fairings typically range in cost from $700 to $1,100 and have been estimated to improve fuel economy by 3 to 7 percent.[9] Side fairings are more commonly used in higher speed, long-haul operations since they can be less effective and have greater potential for damage in lower speed, urban environments. Trailer tails are another option, ranging in cost from $1,000 to $1,600 while having the potential to improve fuel economy by 3 to 5 percent. The EPA found that a combination of multiple trailer fairings (including a combination of front, side, rear, and/or under trailer) which have been SmartWay verified are able to produce 9 percent or greater fuel savings for trailers.[10]
[Back to top]
Tires
Another important factor in truck fuel efficiency is tires. Tire rolling resistance accounts for approximately 30 percent of the energy required to move a line-haul truck on level roads and at highway speeds.[11] There are two types of Low Rolling Resistance (LRR) technologies: tires and retreads.[12] LRR technologies includes any tire technology that reduces rolling resistance and provides a fuel or emissions reduction benefit.
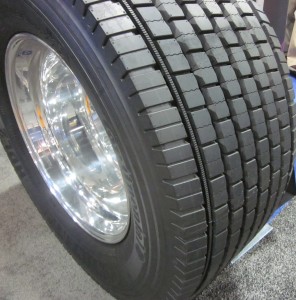
Low Rolling Resistance Tires
Low rolling resistance tires are designed to minimize the friction between the roadway and tire. Specific features may include slightly thinner sidewalls, shallower tread depths and low rolling resistance tread compounds. An ATRI survey found LRR dual tires to be one of the most common fuel saving technologies – used by more than 75 percent of survey respondents.[13] EPA has demonstrated that certain LRR tires and retread technologies can reduce both costs and emissions for long-haul class 8 tractor-trailers by 3 percent or more.[14] The approximate per tire cost is comparable to conventional tires.[15] However, due to the potential for faster tread wear-out, purchasers need to evaluate the cost-benefits of increased tire costs versus lower fuel costs.
Retread technologies
Retread technologies fall into two categories: mold and precure. Both categories can only be implemented on two axle positions: trailer and drive.[16] Mold cure retreading involves applying non-vulcanized rubber tread directly to the top of the buffed tire before being placed into a mold which is then heated so that the rubber within the mold adheres to the tire completely.[17] The precure style of retreading involves using rubber, which has already been vulcanized, with a new tread design. A thin layer of cushioned gum is placed on the area of a newly buffed tire to act as a bond to attach a new layer of procured tread which is ultimately placed directly within a curing chamber to complete the adhering.[18]
Single-Wide Tires
Single-wide tires (also known as “wide-base” or “super-singles”) are estimated to improve fuel efficiency by 2 – 4 percent.[19] Single-wide tires use a single rim with only two sidewalls to replace the conventional dual tire configuration which utilizes two complete tires (i.e. two rims and four sidewalls). Single-wide tires therefore offer the added benefit of weight savings. One study found a five-axle tractor-trailer combination that was equipped with single-wide tires and aluminum rims (which are lighter than standard steel rims) can reduce weight by 840 to 1,416 pounds.[20] This study also found the initial tire and wheel purchase cost was identified as one reason why fleets decided not to test wide-base tires.
Tire Pressure Systems
Under-inflated tires can significantly increase rolling resistance, thus increasing fuel consumption. The Federal Motor Carrier Safety Administration evaluated the effectiveness of tire pressure monitoring systems (TPMS) and automatic tire inflation systems (ATIS).[21] The two motor carriers involved in the field test reported a fuel economy increase of 1.4 percent using the systems. The payback period for these systems, which have a cost of approximately $1,500 per tractor-trailer, was found to range from less than 14 months to less than 6 months for a high-mileage fleet. Another report found reliability to be the number one criteria among fleets when selecting tire pressure systems since downtime negates the efficiency improvement.[22]
[Back to top]
Engines
Diesel engines are significantly more fuel efficient than gasoline engines and the vast majority of large, heavy-duty truck engines are designed to run on diesel fuel. As a result of engine improvements and cleaner fuels, diesel engines today produce 98 percent fewer emissions of nitrogen oxides and particulate matter when compared to earlier versions of these engines.
There are currently several different technologies available that can be used to increase engine efficiency and/or reduce emissions, including (but not limited to):[23]
- Turbocharging– An exhaust-driven turbine drives a compressor to increase the air density going into the engine.
- Electrification of engine accessories– Traditional belt- or gear-driven accessories can be converted to electric power.
- Reduction of engine friction– Engine friction reduction has been pursued continuously by manufacturers through careful design and selection of advanced materials.
- Improvement of diesel exhaust particulate matter (PM) control using a diesel particulate filter (DPF) with a catalyst coating– The use of a DPF can degrade the fuel efficiency of the engine owing to exhaust flow restriction and pressure buildup in the system or the need for additional fuel to maintain the operation of the DPF. The use of catalyst coatings can help promote oxidation and reduce the need for additional fuel.
- Improvement of diesel exhaust catalytic system efficiencies using selective catalytic reduction (SCR)– Control of nitrogen oxide (NOx) has been accomplished with cooled EGR and an SCR catalyst.
- Improved driveline efficiency– New automated mechanical and automatic transmissions have been shown to improve fuel economy resulting in lower emissions.
Federal regulations have played a key role in the advancement of engine technologies. More stringent engine emissions standards for heavy-duty trucks have been phased-in several times over the past two decades, including in 2004 (pulled ahead to 2002 for most manufacturers), 2007, 2010, 2014, 2017 and 2021.While these mandates progressively decreased allowable emissions from truck engines, average fuel economy for combination trucks peaked in the late 1990s and has only recently approached these levels.[24]
The Phase 1 and 2 GHG emissions and fuel consumption standards for medium- and heavy-duty vehicles have contributed to improved fuel economy and represent the federal government’s efforts to mandate reductions in GHG emissions and fuel consumption from trucks. EPA announced on August 5, 2021 they are working to update these GHG standards.[25]
[Back to top]
Alternative Fuels
Alternative fuels are another option for reducing the consumption of petroleum products and emissions and generally include those fuels made from products other than petroleum. Since medium and heavy-duty fleets are comprised largely of diesel engines, natural gas (in both its compressed [CNG] and liquefied [LNG] forms) and biodiesel are viable alternative fuel options. The typical driving range of a vehicle is a key factor in determining the most appropriate alternative fuel. For example, CNG may be a suitable option for port drayage, city refuse haulers and local delivery trucks since these trucks tend to operate in closer proximity to a refueling station.
CNG and LNG. Discoveries of large natural gas reserves across the U.S. have resulted in relatively low and stable natural gas prices. In January 2021, the average retail cost of a gallon of diesel fuel was $2.64 compared to an LNG diesel gallon equivalent (DGE) of $2.76 and a CNG DGE of $2.47.[26] Vehicles that run on natural gas can be an attractive option for certain fleet operators seeking to leverage against fuel volatility. A study conducted by Argonne National Laboratory found that although maintenance costs for LNG trucks are higher than diesel trucks, fuel costs for LNG trucks were 48 percent less than diesel trucks.[27]
Studies have also estimated life-cycle GHG emissions reductions as high as 14 percent when LNG replaces diesel fuel and as high as 22 percent when CNG replaces gasoline in fleet vehicles.[28] It should be noted that most natural gas is a fossil rather than a renewable fuel. However, some natural gas can be produced from renewable sources, such as landfill gas or waste products. Landfill gas achieves an estimated life-cycle GHG emission reduction as high as 93 percent when it replaces diesel fuel while waste gas can achieve credit for avoided life-cycle emissions, in some cases. While these sources provide an opportunity for even greater reductions in GHG emissions, they are less abundant and can be more difficult to capture efficiently. In addition, natural gas trucks are typically less fuel efficient. The spark ignition engine used to power these trucks is roughly 15 less efficient than a diesel counterpart.[29]
In contrast to the price of natural gas, the additional incremental cost of a natural gas truck has been estimated to range from $17,500 for a Class 5 walk-in van to $90,000 for a Class 8 sleeper cab when compared to their diesel counterparts.[30] Few subsidies are available to offset this incremental cost, leaving buyers dependent upon future fuel cost savings to offset the higher purchase price. Although there are limited data, Class 8 CNG tractors have demonstrated operation and maintenance costs around $0.10/mile.[31] For Class 8 diesel tractors, O&M costs show a small spread, typically in the $0.12–$0.19/mile range.
Refueling locations, fuel venting and handling, and facility adaptation are additional issues that must be considered. Another factor is the uncertainty of energy markets. While the price of natural gas has been less volatile than petroleum, the U.S. Energy Information Administration projects higher natural gas (and petroleum) prices into the future.[32] Such an increase in price could extend the payback period for CNG and LNG trucks.
Despite these challenges, several large motor carriers have purchased natural gas-fueled vehicles in recent years.[33] Additionally, fleets that travel “point-to-point” or round-trip routes in operations such as waste collection and local delivery have been using natural gas for years.
Biodiesel and Renewable Diesel. Biodiesel is generally manufactured from vegetable oil or fats, with the majority produced from soybeans, and is available in its pure form (B100) as well as blended with petroleum-based diesel, typically at 2 percent (B2) to 20 percent (B20) ratios. Use of this renewable fuel in its blended form can reduce diesel consumption and most tailpipe emissions without the need to modify the engine. While most major engine manufacturers support using biodiesel blends up to B20, somedo not recommend blends above B5 in certain on-highway vehicles.[34] Additionally, cold weather performance, fuel filter clogging, fuel quality, NOx emissions, and microbial growth are issues which must be considered when using biodiesel or biodiesel blends.[35]
Renewable diesel is an emerging product which is also manufactured from vegetable oil or fats.[36] Similar to petroleum diesel, renewable diesel is refined by hydrotreating in a pure form or when blended with petroleum. The finished fuel meets the ASTM specification for petroleum diesel which, unlike biodiesel, allows it to be transported through the existing petroleum pipeline network.
Biodiesel typically costs more at the pump and on an energy equivalent basis than diesel. In January 2021, B20 cost $0.17 less and B99-100 cost $0.85 more per DGE than diesel.[37] Similarly, renewable diesel generally costs more to produce than petroleum diesel fuel.[38] While the future production levels and price of biodiesel and renewable diesel are uncertain, requirements mandating minimum volumes of these transportation fuels under the federal Renewable Fuel Standard continue to advance their use among motor fuel consumers.
Overall, the primary barriers to increased adoption of alternative fuels by the trucking industry are higher vehicle acquisition costs and fuel availability. In the case of biodiesel, the quality and cost of fuel are the primary concerns. These types of additional costs can be especially prohibitive for smaller fleets and owner-operators that may have limited access to the financial capital necessary to purchase more expensive equipment or fuel. If additional on-site natural gas fueling infrastructure is necessary (which can range from $1 to $4 million), the initial expense can be prohibitive.[39] As of June 2021, nearly half of the nation’s public and private LNG stations were located in two states, California and Texas.[40] Additionally, more than 60 percent of the nation’s public and private fueling stations selling either CNG or biodiesel were found in twelve states.[41] For truck fleets that have irregular routes, this limited fueling infrastructure is a major constraint to the advancement of alternative fuels.
Alternative Powertrains
In addition to the conventional powertrains found on trucks with internal combustion engines, new technologies are emerging that compliment or offer an alternative to these powertrains. These technologies include hybrid electric vehicles (HEVs) and all-electric vehicles (EVs). EVs are further defined by the power source which runs the vehicle’s electric motor, either a battery-electric vehicle (BEV) or a fuel cell electric vehicle (FCEV). ATRI research provided a comparative assessment of life-cycle CO2 emissions utilizing federal and industry-sourced data and found a 30 percent decrease for EVs and 45 percent for FCEVs[42]. These technologies are discussed in more detail below.
Hybrid Electric Vehicle. Hybrid electric vehicles are used primarily in package and beverage delivery fleets. These vehicles provide increased fuel efficiency and air quality benefits. The cost of a hybrid heavy-duty truck can be as much as $60,000 more than a comparable diesel truck.[43] Since these vehicles tend to be used in urban operations, overall mileage and fuel usage may be lower and require a longer payback period to offset the higher initial cost.
FedEx has been using hybrid electric trucks for urban deliveries for several years. In 2012, the company reported improving the fuel efficiency of its vehicle fleet by nearly 20 percent over a five-year period, in part, through the operation of 364 hybrid electric vehicles.[44] UPS has also deployed nearly 400 hybrid electric vehicles that have improved fuel economy by 35 percent compared to the trucks that were replaced.[45] As of 2018, UPS uses more than 1,000 electric and hybrid electric vehicles.[46]
Battery Electric Vehicles
Battery electric vehicles (BEVs) rely on onboard battery storage to provide the electricity used to power one or more electric motors. BEVs need to be plugged into an electric charger to refuel, thus either depot charging or a network of charging stations is needed. In addition, adequate onboard battery storage capacity is needed to match the vehicle’s mileage needs between refueling.
There are a number of resources available which discuss various aspects of this emerging technology, including EPA’s Smartway program which offers a number of resources ranging from total cost of ownership calculators to technology readiness evaluations.[47] In addition, vehicle availability is evolving with more models and applications becoming available.[48] How BEVs integrate into the commercial vehicle fleet is still to be determined. One analysis assumes BEVs will be best for shorter-range applications or when dwell time is not a concern, and are complemented by fuel cell powertrains that may be better for longer ranges or operating scenarios that require higher uptime.[49]
Fuel Cell Electric Vehicles.
Fuel cell electric vehicles(FCEVs) operate similar to BEVs: however, their energy is generated onboard the vehicle via electricity produced by a fuel cell. Fuel cells produce electricity through a chemical reaction, generally involving hydrogen. The electricity generated by the fuel cell is transfered to an electric battery which powers one or more electrical motors. Only water vapor is emitted from the tailpipe.[50] Hydrogen’s energy yield is 122 kilojoules per gram, which equates to 2.75 times higher than energy generated by fossil fuels.[51] Projections have hydrogen trucks numbering around 12,000 vehicles on the road in the U.S. by 2030.[52]
FCEVs face similar challenges as natural gas vehicles and BEVs: fueling infrastructure and a high initial purchase cost.[53] Today, a passenger FCEV offers a similar range as its fossil fuel powered counterpart: ~300 miles.[54] Hydrogen is currently being used by trucks in gaseous form, however research is currently being conducted on using it in a liquid form. As a liquid, hydrogen is twice as dense as its gaseous state and can take a vehicle nearly twice the distance as gaseous hydrogen. Manufacturers are looking into making tanks which can store liquid hydrogen on the vehicle.[55] [Back to top]
Cargo Management Systems
More efficient utilization of trailer space, whether through reduced empty trailer miles or strategic trailer loading, can further improve a fleet’s productivity. According to ATRI research, from 17 to 20 percent of for-hire fleet miles were non-revenue or “empty” miles.[56]
For a typical long-haul truck traveling 100,000 miles per year, this averages approximately 18,000 non-revenue producing miles annually while consuming nearly 2,800 gallons of fuel. Assuming a diesel fuel price of $3.06 per gallon, non-revenue fuel costs would be more than $8,400 annually. In 2017, empty miles were estimated to account for roughly 74.2 million metric tons of GHG emissions in the United States.[57] As shown, matching freight demand to available capacity can be an important practice for saving fuel, lowering operating costs, and benefiting the environment through reduced emissions.
The Centre for Data and Analysis in Transportation studied the use of electronic vehicle management systems (EVMS) to improve trailer capacity utilization in Canada. Such systems are intended to match available freight capacity with demand for freight services from shippers.[58] The research found a 16 percent increase in the capacity utilization of trucks using EVMS.
In the U.S., the Federal Highway Administration’s (FHWA) Cross-Town Improvement Project (C-TIP) developed methods to reduce the number of empty trailers moving between terminals in Kansas City by better coordinating cross-town truck traffic. C-TIP utilized several technologies to accomplish this, including real-time traffic monitoring, dynamic route guidance, chassis utilization tracking and wireless drayage updating. A pilot test of the wireless drayage updating system demonstrated a 13 percent reduction in empty trailer trips, saving a modest 121 gallons of fuel for the participating carriers over a 2 month period.[59] According to FHWA, the cost of this type of service is expected to be low. A similar pilot test conducted in Chicago over four months in 2011 resulted in a 52 percent reduction in empty trailer movements.[60] Combined, these systems have the potential not only to help carriers increase productivity through better asset management, but to reduce congestion levels in the surrounding areas.
Motor carriers also rely on a variety of private systems to match freight demand to truck availability. One fleet found improvements in data accuracy allowed them to further build out loads.[61] Further, the emergence of load boards, which use the internet and/or cell phones, to match freight loads to truck availability are another practice which is reducing empty miles.
Transponders, including radio frequency identification devices (RFID) tags, in addition to cell phones can also be used to optimize cargo management. Transponders can be used to monitor and track the location of trailers, intermodal containers, and cargo in real-time. These devices also allow the identification of trucks in order to bypass weight stations, tolls plaza and at security check points.
Companies that operate their own fleet of trucks to support their primary business (i.e., private fleets) may be able to maximize their utilization of trailer space with compact packaging and innovative loading techniques. For example, Walmart found that the use of a two-step safety stool increased trailer fills by nearly 3 percent.[62] In addition, a new load designer system in their grocery operations identifies unused space and more accurately designates pallet positions for optimal loading/off-loading.
Other examples of strategic loading include mixing items with high and low weights in order to balance space and weight limitations. Some carriers have been able to increase the number of pallets loaded onto a trailer using a technique called “pin-wheeling” (i.e. turning every other pallet by 90 degrees). Research found this technique resulted in an additional two pallets in a standard trailer.[63] As shown by these examples, cargo management systems encompass a broad range of technologies and practices and continue to emerge as an important component of the sustainable practices being used by the trucking industry.
[Back to top]
Higher Productivity Vehicles
Another way of improving fuel efficiency and reducing emissions is through the use of higher productivity vehicles (HPVs). HPVs operate at heavier weights and/or longer lengths than traditional vehicle configurations. A number of studies have found HPVs to be more efficient at moving freight.
Among the three countries participating in the North American Free Trade Agreement (NAFTA), the United States has the lowest gross vehicle weight (GVW) limit.[64] In the U.S., trucks are generally limited to an overall GVW limit of 80,000 pounds and typically use a single trailer that is 53 feet in length or less or two trailers of 28 feet or less.[65] As shown in Figure 2.2, several states allow HPVs to operate on portions of the national highway system (NHS) without special permitting (but under certain restrictions). These states have been granted “grandfather rights” by the U.S. Congress which allow the operation of vehicles at weights and lengths greater than the current federal limits.
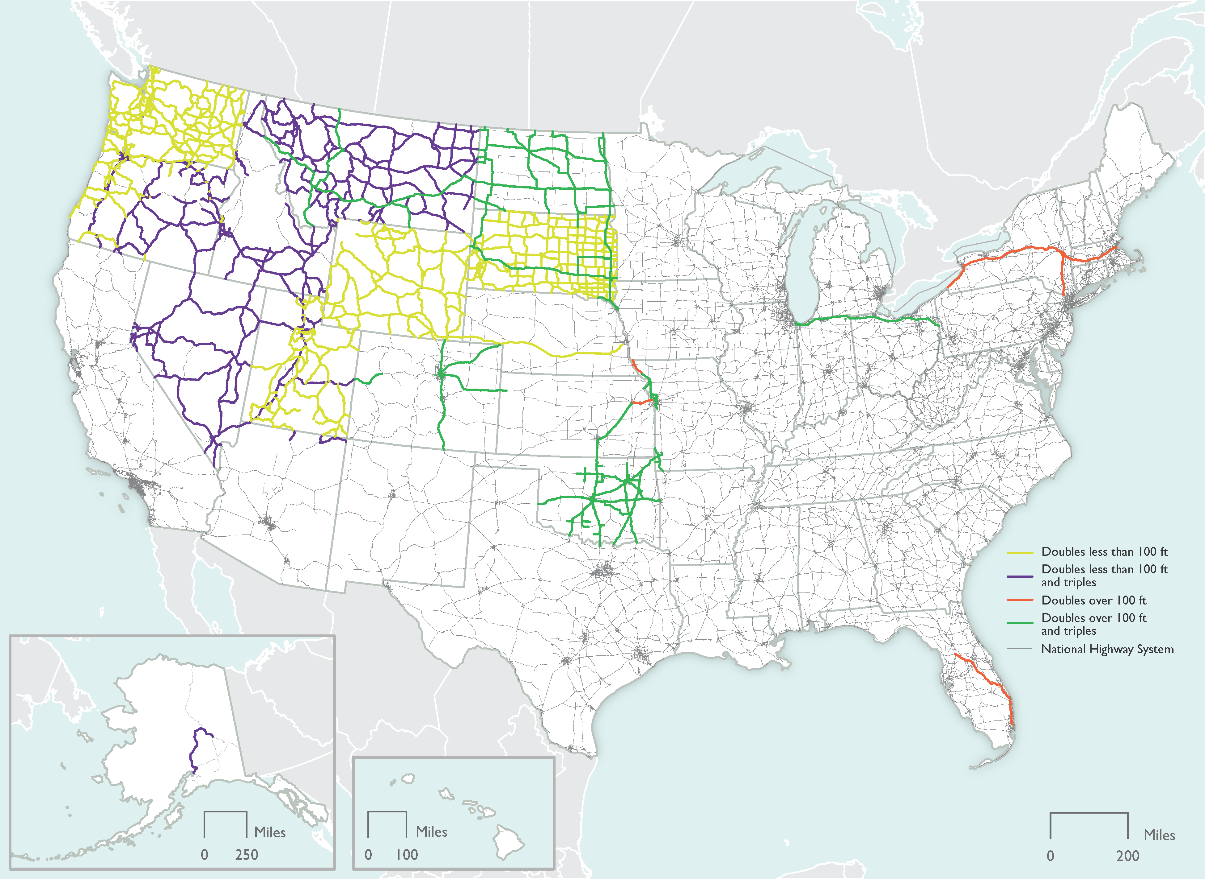
Figure 2.2. Permitted Longer Combination Vehicleson the National Highway System: 2017[66]
Examples of HPVs in use today include a six-axle tractor-semitrailer, a Rocky Mountain double, a triple trailer combination and a turnpike double as shown in Figure 2.3.
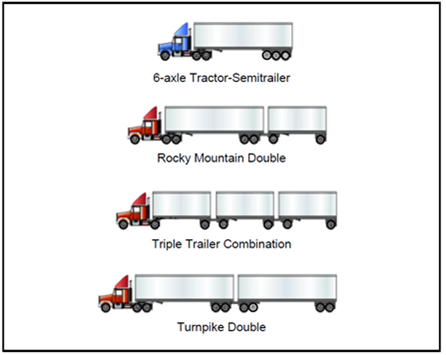
Figure 2.3. Common Higher Productivity Vehicle Configurations
Over several decades, states, motor carriers, shippers and other stakeholders have proposed changes to the federal truck size and weight limits and several states have sought exemptions from the federal limit in order to expand the HPV network. In late 2009, Congress approved a bill (H.R. 2112) that created a pilot program in Maine and Vermont allowing 108,000 to 120,000-pound six-axle trucks to operate on Interstate highways in Vermont and 100,000-pound six-axle trucks on Interstate highways in Maine. The benefits of the program were illustrated by Champlain Oil Company, which saved 43,400 gallons of diesel fuel and traveled 320,000 fewer miles during the one-year program.[67] While the pilot program expired in December 2010, legislation which exempts the Maine and Vermont Interstate highways from federal vehicle weight limits for a 20-year period was signed into law in November 2011.[68]
In the ATRI report Energy and Emissions Impacts of Operating Higher Productivity Vehicles, Update 2008, researchers quantified the energy and emissions impacts that can result from operating trucks at various weights and configurations.[69] Six common vehicle configurations were modeled through this research over a typical route to estimate fuel consumption and emissions. Increases in fuel efficiency were observed for nearly every HPV configuration evaluated. As an example, vehicles operating at 120,000 pounds GVW had fuel efficiency increases that ranged from 15 to 31 percent while increases of 33 percent were observed for vehicles operating at 140,000 pounds GVW.
In Canada, the Ontario Ministry of Transportation, after initiating a pilot program to evaluate longer combination vehicle (LCV) operations, now allows a limited number of LCVs on designated Ontario highways.[70] The program reports that each LCV uses approximately one-third less fuel than the two tractor-trailers it replaced. It also estimates that, in a typical year, LCVs eliminated 9 million tonnes of greenhouse gases.
A Canadian Trucking Alliance report documents the potential benefits of HPV operations in the provinces of Quebec, Alberta, Manitoba and Saskatchewan.[71] The focus of this research was the turnpike double (a Class 7 or 8 tractor pulling two semitrailers) and researchers collected actual fuel consumption data from carriers. The findings were consistent with previous research that found HPVs can yield fuel consumption savings of 30 percent or more.
Furthermore, in a study commissioned by Alberta Infrastructure, researchers found that HPVs were significantly more efficient than conventional tractor-trailer combinations.[72] The use of HPVs (at a GVW of 62,500 kg and a length of 37 m or approximately 137,800 lbs. and 121 ft.) within the Alberta province has saved shippers approximately C$40 million annually and reduced traffic levels by nearly 44 percent.[73] Across the study network, the annual diesel fuel consumed by trucks has been reduced by 32 percent through the use of HPVs, which equates to an annual fuel savings of approximately 4 million gallons.[74]
Another country which studies HPVs is Australia. The Transport Certification of Australia currently implements two HPV monitoring schemes: Telematics Monitoring Application (TMA) and Intelligent Access Program (IAP). Both schemes are administered by the Victoria Department of Transport to permit access of eligible HPVs on approved roads.[75] Data is collected from smart OBM systems and standardized to enable new productivity and safety initiatives using a National Telematics Framework.[76] As of Q1 2021 all HPVs will be required to have a Smart OBM system fitted and be enrolled in either IAP or TMA.
In the United States, FHWA examined potential changes to the federal truck size and weight limits through its 2000 Comprehensive Truck Size and Weight Study.[77] The study outlines several scenarios where potential changes in truck size and weight could be made; the outcome of the four HPV scenarios were decreases in total truck vehicle miles traveled (VMT) ranging from 10.6 to 23.2 percent and decreases in energy costs of 6.2 to 13.8 percent.
Changes in federal law are the key to the increased deployment of HPVs. The surface transportation authorization bill, Moving Ahead for Progress in the 21st Century (MAP 21 – 2012), included provisions for a two-year study on the impacts of increased truck sizes and weights.[78] The study, which was released in April 2016, analyzed five focus areas: 1) modal shift, 2) safety, 3) pavement, 4) bridges, and 5) compliance. While the study identified potential impacts if changes were made to trucks sizes and weights, it did not make any policy recommendations.
Since some states currently allow twin 33-foot trailers, a number of motor carriers have already evaluated their performance. Based on data supplied by FedEx, ABF System, Con-way, Estes Express, Old Dominion Freight Line, UPS and YRC Worldwide, the industry could absorb up to 18 percent of future freight growth without any change in gross vehicle weight or additional miles traveled if the standard for twin trailers was increased to 33-feet.[79]
[Back to top]
[1] Environmental Protection Agency. “Improved Aerodynamics: A Glance at Clean Freight Strategies.” SmartWay Transport Partnership. Available online: https://nepis.epa.gov/Exe/ZyPURL.cgi?Dockey=P100XM9X.txt
[2] Environmental Protection Agency. (2011). “EPA and NHTSA Adopt First-ever Program to Reduce Greenhouse Gas Emissions and Improve Fuel Efficiency of Medium- and Heavy-duty Vehicles.” Available online: https://www.epa.gov/regulations-emissions-vehicles-and-engines/final-rule-phase-1-greenhouse-gas-emissions-standards-and
[3] Environmental Protection Agency. (October 2016). “Final Rule for Greenhouse Gas Emissions Standards and Fuel Efficiency Standards for Medium- and Heavy-Duty Engines and Vehicles – Phase 2”. Available online: https://www.epa.gov/regulations-emissions-vehicles-and-engines/final-rule-phase-2-greenhouse-gas-emissions-standards
[4] Environmental Protection Agency. “Improvements for Heavy-Duty Engine and Vehicle Test Procedures, and Other Technical Amendments.” Final Rule. Available online: https://www.govinfo.gov/content/pkg/FR-2021-06-29/pdf/2021-05306.pdf
[5] Environmental Protection Agency. (August 2021). “Regulatory Update.” Available online: https://www.epa.gov/system/files/documents/2021-08/420f21057.pdf
[6] Committee to Assess Fuel Economy Technologies for Medium- and Heavy-Duty Vehicles, National Research Council. (2010). “Technologies and Approaches to Reducing the Fuel Consumption of Medium- and Heavy-Duty Vehicles.” Transportation Research Board. pp 133-138. Available online: http://www.nap.edu/catalog.php?record_id=12845
[7] Truck Manufacturers Association. (2007). “Test, Evaluation and Demonstration of Practical Devices/Systems to Reduce Aerodynamic Drag of Tractor/Semitrailer Combination Unit Trucks.” National Energy Technology Laboratory. Available online: https://www.osti.gov/scitech/servlets/purl/926158
[8] Ibid.
[9] North American Council for Freight Efficiency (2016). “Confidence Report on Trailer Aerodynamic Device Solutions.”
[10] U.S. Environmental Protection Agency. “SmartWay-verified Aerodynamic Technologies.” SmartWay. Available online: https://www.epa.gov/sites/default/files/2016-03/documents/420f15006.pdf
[11] National Research Council. (2014). “Reducing the Fuel Consumption and Greenhouse Gas Emissions of Medium- and Heavy-Duty Vehicles, Phase Two.” Transportation Research Board. Available online: http://www.nap.edu/catalog.php?record_id=18736
[12] U.S. Environmental Protection Agency. “Learn Aboout Low Rolling Resistance (LRR) New and Retread Tire Technologies.” Available online: https://www.epa.gov/verified-diesel-tech/learn-about-low-rolling-resistance-lrr-new-and-retread-tire-technologies
[13] Schoettle, B., M. Sivak, M. Tunnell. (October 2016). “A Survey of Fuel Economy and Fuel Usage by Heavy-Duty Truck Fleets.” University of Michigan/American Transportation Research Institute. Available online: https://truckingresearch.org/wp-content/uploads/2016/10/2016.ATRI-UMTRI.FuelEconomyReport.Final_.pdf
[14] U.S. Environmental Protection Agency. Ibid.
[15] Downing, K. and S. Matthews. (2010). “Improving Truck Efficiency and Reducing Idling.” State of Oregon Department of Environmental Quality. Available online: http://www.oregon.gov/deq/FilterDocs/improveEfficiencyReport.pdf
[16] U.S. Environmental Protection Agency. Ibid.
[17] Service Tire Truck Centers. (August 28, 2018). “Mold Cure vs. Pre Cure: What’s the Difference Between the Two Tire Retreading Styles?” Available online: https://www.sttc.com/mold-cure-vs-pre-cure-tire-retreading-styles/
[18] Ibid.
[19] North American Council for Fuel Efficiency. (August 13, 2015). “Confidence Report: Low Rolling Resistance Tires.”
[20] Ibid.
[21] U.S. DOT, FMCSA. (February 2014). “Advanced Sensors and Applications: Commercial Motor Vehicle Tire Pressure Monitoring and Maintenance.”
[22] North American Council for Freight Efficiency, Tire Pressure Systems (August 15, 2013).
[23] National Research Council, Transportation Research Board. Reducing the Fuel Consumption and Greenhouse Gas Emissions of Medium- and Heavy-Duty Vehicles, Phase Two, p. 2-6 (First Report, 2014). Available online: http://www.nap.edu/catalog.php?record_id=18736
[24] U.S. Department of Energy. “Transportation Energy Data Book: Edition 35 – 2016.” Available online: http://cta.ornl.gov/data/index.shtml
[25] U.S. Environmental Protection Agency. “Regulations for Greenhouse Gas Emissions from Commercial trucks & Buses.” Available Online: https://www.epa.gov/regulations-emissions-vehicles-and-engines/regulations-greenhouse-gas-emissions-commercial-trucks
[26] U.S. Department of Energy. (June 21, 2021). “Clean Cities Alternative Fuel Price Report, January 2017.” Alternative Fuels Data Center. Available online: https://afdc.energy.gov/files/u/publication/alternative_fuel_price_report_january_2021.pdf
[27] Smajla, Ivan, Daria Karasalihović Sedlar, Branko Drljača, and Lucija Jukić. (2019). “Fuel switch to LNG in heavy truck traffic.” Energies. 12, no. 3: 515.
[28] California Air Resource Board. (2016). “Carbon Intensity Values of Current Certified Pathways.” Available online: https://www.arb.ca.gov/fuels/lcfs/fuelpathways/pathwaytable.htm
[29] National Research Council. (2014). “Reducing the Fuel Consumption and Greenhouse Gas Emissions of Medium- and Heavy-Duty Vehicles, Phase Two.” Transportation Research Board
[30] California Air Resources Board, Draft Advanced Clean Fleets Total Cost of Ownership Discussion Document, p. 12 (September 9, 2021), Available online: https://ww2.arb.ca.gov/sites/default/files/2021-08/210909costdoc_ADA.pdf
[31] Hunter et al,. (September 2021). “Spatial and Temporal Analysis of the Total Cost of Ownership for Class 8 Tractors and Class 4 Parcel Delivery Trucks.” NREL. Available online: https://www.nrel.gov/docs/fy21osti/71796.pdf
[32] U.S. Energy Information Administration. “Short-Term Energy Outlook – Natural Gas.” Available online: https://www.eia.gov/outlooks/steo/report/natgas.cfm
[33] Gladstein, Neandross & Associates (GNA), “State of Sustainable Fleets 2021 Market
and Trends Brief”, (May 2021), Available online: http://www.StateofSustainableFleets.com
[34] National Biodiesel Board. “OEM Statement Summary Chart.” Available online: https://www.biodiesel.org/using-biodiesel/oem-information
[35] National Renewable Energy Laboratory. (2009). “Biodiesel Handling and Use Guide.” Available online: https://www.nrel.gov/docs/fy09osti/43672.pdf
[36] U.S. Department of Energy. “Hydrogenation-Derived Renewable Diesel.” Alternative Fuels Data Center. Available online: http://www.afdc.energy.gov/fuels/emerging_green.html
[37] U.S. Department of Energy. (January 2021). “Alternative fuel price report.” Alternative Fuels Data Center. Available online: https://afdc.energy.gov/files/u/publication/alternative_fuel_price_report_january_2021.pdf
[38] Milbrandt, A., C. Kinchin, and R. McCormick. (December 2013). “The Feasibility of Producing and Using Biomass-Based Diesel and Jet Fuels in the United States.” National Renewable Energy Laboratory.
[39] U.S. Department of Energy. “Natural Gas Fueling Infrastructure Development.” Alternative Fuels Data Center. Available online: http://www.afdc.energy.gov/fuels/natural_gas_infrastructure.html
[40] U.S. Department of Energy. “Alternative Fueling Station Total Counts by State and Fuel Type.” Alternative Fuels Data Center. Available online: http://www.afdc.energy.gov/afdc/fuels/stations_counts.html
[41] Ibid.
[42] Jeffrey Short and Danielle Crownover, Understanding the CO2 Impacts of Zero-Emission Trucks; A Comparative Life-Cycle Analysis of Battery Electric, Hydrogen Fuel Cell and Traditional Diesel Trucks, American Transportation Research Institute (March 2022), https://truckingresearch.org/2022/05/03/understanding-the-co2-impacts-of-zero-emission-trucks/.
[43] California Air Resources Board. (May 23, 2014). “Fiscal Year 2014-15 Funding Plan for the Air Quality Improvement Program and Low Carbon Transportation Greenhouse Gas Reduction Fund Investment.” Hybrid Truck and Bus Voucher Incentive Project. Available online: www.californiahvip.org.
[44] FedEx Newsroom. (2012). “FedEx Long-Term Commitment to Sustainability Gets a Boost: Emission Reduction Goal Increased Fifty Percent.” Available online: https://newsroom.fedex.com/newsroom/fedex-long-term-commitment-to-sustainability-gets-a-boost-emissions-reduction-goal-increased-fifty-percent/
[45] UPS Press Release. “Saving Fuel: Alternative Fuels Drive UPS to Innovative Solutions.” Available online: http://pressroom.ups.com/Fact+Sheets/Saving+Fuel%3A+Alternative+Fuels+Drive+UPS+to+Innovative+Solutions
[46] UPS. (2019). “Accelerating Sustainable Solutions.” Available online: https://about.ups.com/content/dam/upsstories/assets/reporting/2019-UPS-Corporate-Sustainability-Progress-Report.pdf
[47] U.S. Environmental Protection Agency. “SmartWay Heavy-Duty Truck Electrification Resources.” Available online: https://www.epa.gov/smartway/smartway-heavy-duty-truck-electrification-resources
[48] Calstart, “Zero-Emission Technology Inventory.” Available online: https://globaldrivetozero.org/tools/zero-emission-technology-inventory/
[49] Hunter, Chad, Michael Penev, Evan Reznicek, Jason Lustbader, Alicia Birky, and Chen Zhang. (2021). “Spatial and Temporal Analysis of the Total Cost of Ownership for Class 8 Tractors and Class 4 Parcel Delivery Trucks.” Golden, CO: National Renewable Energy Laboratory. NREL/TP-5400-71796. https://www.nrel.gov/docs/fy21osti/71796.pdf
[50] Bomey, Nathan. (October 26, 2020). “Why the next truck you see may be a quiet, zero-emission hydrogen fuel cell rig.” USA Today. Available online: https://www.usatoday.com/story/money/2020/10/26/hydrogen-trucks-nikola-gm-toyota-hyundai-zero-emissions/5981340002/
[51] Ahmed, Adeel, et al. (2016). “Hydrogen fuel and transport system: A sustainable and environmental future.” International journal of hydrogen energy 41.3: 1369-1380.
[52] Ibid
[53] Wayland, Michael. (June 21, 2021). “By ‘land, sea and air,’ GM plans to expand fuel-cell business beyond EVs.” CNBC. Available online: https://www.cnbc.com/2021/06/21/by-land-sea-and-air-gm-to-expand-fuel-cell-business-beyond-evs.html
[54] Twi-Global. “What are the pros and cons of hydrogen fuel cells?” Available online: https://www.twi-global.com/technical-knowledge/faqs/what-are-the-pros-and-cons-of-hydrogen-fuel-cells
[55] Lockridge, Deborah. (July 29, 2021). “Hyzon Looks to Liquid Hydrogen for us to 1,000-mile ZEV Range.” Heavy-Duty Trucking. https://www.truckinginfo.com/10148327/hyzon-looks-to-liquid-hydrogen-for-up-to-1-000-mile-zev-range
[56] Williams, Nathan and Dan Murray. (November 2020). “An Analysis of the Operational Costs of Trucking: 2020 Update.” American Transportation Research Institute. Available online: https://truckingresearch.org/atri-research/operational-costs-of-trucking/
[57] Sporrer, Alyssa. (November 13, 2020). “5 Trucking Sustainability Trends for 2021.” Freight Waves. Available online: https://www.freightwaves.com/news/5-trucking-sustainability-trends-for-2021
[58] Barla, P., et al., (2010). “Information Technology and Efficiency in Trucking.” Centre for Data and Analysis in Transportation, Québec, Canada.
[59] Schiller, R. (January 1, 2012). “C-TIP Evaluation: Results and Lessons Learned” Talking Freight Presentation.
[60] Ibid.
[61] Walmart. (2014). “Global Responsibility Report.” Available online: http://cdn.corporate.walmart.com/db/e1/b551a9db42fd99ea24141f76065f/2014-global-responsibility-report.pdf
[62] Ibid.
[63] Santalucia, A., et al. (2011). “Beyond SmartWay: New Opportunities for Fuel Savings and Emission Reductions in the Trucking Sector.” ICF International, Transportation Research Board.
[64] Transportation Research Board. (2002). “Regulation of Weights, Lengths, and Widths of Commercial Motor Vehicles, Special Report 267.” Washington, D.C. Available online: http://onlinepubs.trb.org/onlinepubs/sr/sr267.pdf
[65] The Federal government began regulating truck size and weight limits in 1956 with the construction of the Interstate Highway System. Congress established a maximum gross vehicle weight limit of 73,280 pounds along with maximum weights of 18,000 pounds on single axles and 32,000 pounds on tandem axles for vehicles operating on the Interstate system. The Federal-Aid Highway Act Amendments of 1974 increased the maximum GVW to 80,000 pounds and to 20,000 pounds on single axles and 34,000 pounds on tandem axles. This increase was due in part to the rising fuel costs at the time. The Surface Transportation Assistance Act of 1982 expanded the federal authority, essentially overriding several more restrictive “barrier” states located along the Mississippi that had not adopted the previous size and weight limit increase. The most recent legislation related to truck size and weight limits was in the Intermodal Surface Transportation Efficiency Act of 1991, which froze the limits to those established in 1974.
[66] U.S. Department of Transportation, Bureau of Transportation Statistics and Federal Highway Administration, Freight Analysis Framework, version 4.5, 2019
[67] Heavy Duty Trucking. (January 26, 2011). “Bill Would Make Larger Truck Pilot Program Permanent.” Available online: https://www.truckinginfo.com/105763/bill-would-make-larger-truck-pilot-program-permanent
[68] H.R 2112 was signed into law on November 18, 2011 and contained the following:
“Sec. 125. Section 127(a)(11) of title 23, United States Code, is amended to read as follows:
(11)(A) With respect to all portions of the Interstate Highway System in the State of Maine, laws (including regulations) of that State concerning vehicle weight limitations applicable to other State highways shall be applicable in lieu of the requirements under this subsection through December 31, 2031. (B) With respect to all portions of the Interstate Highway System in the State of Vermont, laws (including regulations) of that State concerning vehicle weight limitations applicable to other State highways shall be applicable in lieu of the requirements under this subsection through December 31, 2031.
[69] Tunnell, M.A. (2008). “Energy and Emissions Impacts of Operating Higher Productivity Vehicles, Update 2008.” American Transportation Research Institute. Available online: https://truckingresearch.org/2008/03/26/energy-and-emissions-impacts-of-operating-higher-productivity-vehicles/
[70] Ontario Ministry of Transportation. “Long Combination Vehicle (LCV) Program.” Available online: http://www.mto.gov.on.ca/english/trucks/long-combination-vehicles.shtml
[71] Canadian Trucking Alliance. (2006). “Evaluating Reductions in Greenhouse Gas Emissions Through the Use of Turnpike Double Truck Combinations and Defining Best Practices for Energy Efficiency.” L-P Tardif & Associates Inc. in association with Ray Barton Associates Ltd.
[72] Woodrooffe, J. and Ash, L., (2001). ”Economic Efficiency of Long Combination Transport Vehicles in Alberta.” Woodrooffe and Associates. Available online: http://www.transportation.alberta.ca/Content/docType61/production/LCVEconomicEfficiencyReport.pdf
[73] Compared to traffic levels if those vehicle movements had occurred in non-HPV trucks.
[74] Woodroofe, et al. Ibid.
[75] TCA. “High Productivity Freight Vehicle Monitoring.” Available online: https://tca.gov.au/scheme/high-productivity-freight-vehicle-monitoring/
[76] TCA. “Smart OBM Systems are here.” Available online: https://tca.gov.au/smart-obm-systems/
[77] U.S. Department of Transportation. (2000). “Comprehensive Truck Size and Weight Study.”
[78] U.S. Department of Transportation. “MAP21 Moving Ahead for Progress in the 21st Century Act.” FMCSA. Available online: https://www.fmcsa.dot.gov/mission/policy/map-21-moving-ahead-progress-21st-century-act
[79] Vice, A. (February 27, 2014). “FedEx presses Congress for 33-ft. twin trailers.” Fleet Owner Magazine. Available online: http://fleetowner.com/fleet-management/fedex-presses-congress-33-ft-twin-trailers