Since 2002, the American Transportation Research Institute (ATRI) has collected and processed truck GPS data in support of the U.S. Department of Transportation Freight Mobility Initiative. Utilizing an extensive database of freight truck GPS data, ATRI develops and monitors a series of key performance measures on the nation’s freight transportation system. Among its many GPS analyses, ATRI converts its truck GPS dataset into an ongoing truck bottleneck analysis that is used to quantify the impact of traffic congestion on truck-borne freight at over 325 specific locations. While other outside analyses may identify congested corridors, no dataset available today specifically identifies granular chokepoints in the nation’s truck freight transportation system.
Measuring the performance of freight movement across our nation’s highways is critical to understanding where and at what level investments should be made. The information provided through this research empowers decision-making in both the private and public sectors by helping stakeholders better understand how congestion and delays constrain mobility on the U.S. highway transportation system. ATRI’s annual bottleneck list provides a clear roadmap for reducing supply chain impediments and guiding investment decisions as Congress begins to focus attention on our country’s next transportation investment reauthorization bill.
ATRI’s bottleneck analysis incorporates and synthesizes several unique components, including a massive database of truck GPS data at freight-significant locations throughout the U.S., and a speed/volume algorithm that quantifies the impact of congestion on truck-based freight. In addition, the annual reports provide a chronological repository of mobility profiles, allowing congestion changes to be assessed over time. This allows both transportation analysts and planners to conduct performance benchmarking and identify influential factors contributing to congestion and the requisite consequences on freight mobility.
- Jayne Byrne Interchange – Documenting the Impact of Infrastructure Investments on Traffic Congestion.
- Click here to view the 2025 Bottleneck Top Ten Location Animations.
- Click here for an Executive Summary of the 2025 analysis.
- Click here for a description of the research methodology.
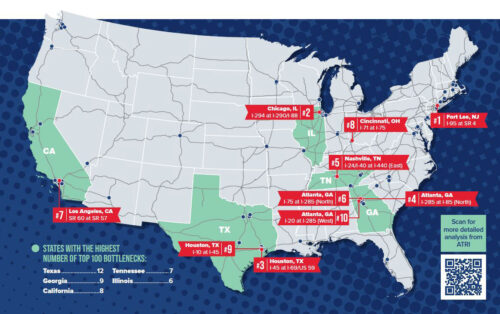
States with one or more of the top 100 truck bottlenecks are shown in blue on the map below. A PDF of the congestion profile for each top 100 location within a state can be downloaded by clicking on the respective state then clicking hyperlink in pop-up.
The table below the map contains the top 100 bottleneck locations in rank order. You can view an individual congestion profile by clicking on each location’s hyperlink. The table can also be sorted by clicking the header in each column.
States with a Top 100 Truck Bottleneck
States Not in Top 100