Congestion
Ranking | Congestion Description | State | Average
Speed | Peak
Average
Speed | Non-Peak
Average
Speed | Peak
Average
Speed
Percent
Change
2022-2023 |
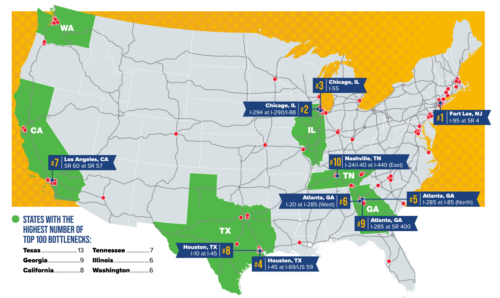
| 1 | Fort Lee, NJ: I-95 at SR 4 | NJ | 27.1 | 19.9 | 30.2 | -1.4% |
| 2 | Chicago, IL: I-294 at I-290/I-88 | IL | 42.8 | 35.4 | 46.0 | -6.4% |
| 3 | Chicago, IL: I-55 | IL | 35.3 | 25.2 | 40.6 | 0.3% |
| 4 | Houston, TX: I-45 at I-69/US 59 | TX | 30.4 | 20.9 | 34.6 | -3.6% |
| 5 | Atlanta, GA: I-285 at I-85 (North) | GA | 36.6 | 26.8 | 41.0 | -5.9% |
| 6 | Atlanta, GA: I-20 at I-285 (West) | GA | 42.1 | 36.4 | 44.3 | 0.3% |
| 7 | Los Angeles, CA: SR 60 at SR 57 | CA | 42.4 | 35.2 | 45.1 | -1.5% |
| 8 | Houston, TX: I-10 at I-45 | TX | 37.8 | 26.3 | 43.7 | -4.9% |
| 9 | Atlanta, GA: I-285 at SR 400 | GA | 37.4 | 30.2 | 40.5 | -10.3% |
| 10 | Nashville, TN: I-24/I-40 at I-440 (East) | TN | 40.2 | 28.3 | 45.5 | -7.4% |
| 11 | Los Angeles, CA: I-710 at I-105 | CA | 37.5 | 27.5 | 42.7 | -3.7% |
| 12 | Atlanta, GA: I-75 at I-285 (North) | GA | 43.0 | 35.3 | 46.5 | -8.7% |
| 13 | Chicago, IL: I-290 at I-90/I-94 | IL | 29.6 | 21.1 | 32.7 | 16.0% |
| 14 | Cincinnati, OH: I-71 at I-75 | OH | 46.9 | 42.4 | 48.6 | -1.3% |
| 15 | Dallas, TX: I-45 at I-30 | TX | 36.3 | 26.3 | 40.7 | -4.3% |
| 16 | McDonough, GA: I-75 | GA | 46.8 | 42.6 | 48.5 | -0.4% |
| 17 | Chicago, IL: I-90 at I-94 (South) | IL | 39.8 | 30.7 | 43.3 | -11.9% |
| 18 | Ontario, CA: I-10 at I-15 | CA | 42.8 | 35.4 | 45.5 | 3.8% |
| 19 | Washington, D.C.: I-495 (West Side) | DC | 35.6 | 28.9 | 38.0 | -10.8% |
| 20 | Hartford, CT: I-84 at I-91 | CT | 46.1 | 38.0 | 49.1 | -9.9% |
| 21 | Atlanta, GA: I-20 at I-285 (East) | GA | 43.5 | 36.4 | 46.6 | -1.7% |
| 22 | Houston, TX: I-45 at I-610 (North) | TX | 39.3 | 27.6 | 45.1 | -4.1% |
| 23 | Nashville, TN: I-40 at I-65 (East) | TN | 40.3 | 30.9 | 44.7 | -8.3% |
| 24 | Chicago, IL: I-90 at I-94 (North) | IL | 30.5 | 18.6 | 35.8 | -9.7% |
| 25 | Denver, CO: I-70 at I-25 | CO | 41.1 | 33.5 | 44.4 | 9.3% |
| 26 | Houston, TX: I-10 at I-610 (West) | TX | 44.5 | 33.0 | 49.8 | -5.8% |
| 27 | Gary, IN: I-65 at I-80 | IN | 48.3 | 46.0 | 49.1 | -8.2% |
| 28 | Portland, OR: I-5 at I-84 | OR | 34.1 | 26.8 | 37.7 | -9.5% |
| 29 | Baton Rouge, LA: I-10 at I-110 | LA | 38.3 | 31.5 | 41.6 | 2.5% |
| 30 | Vancouver, WA: I-5 at Columbia River | WA | 42.7 | 37.6 | 44.8 | -5.4% |
| 31 | Chicago, IL: I-80 at I-94 | IL | 49.9 | 48.3 | 50.5 | 7.9% |
| 32 | Philadelphia, PA: I-76 at I-676 | PA | 29.8 | 23.8 | 32.0 | -5.4% |
| 33 | Stamford, CT: I-95 | CT | 40.5 | 30.0 | 43.9 | -1.4% |
| 34 | Indianapolis, IN: I-65 at I-70 (North) | IN | 46.9 | 40.0 | 50.2 | 13.9% |
| 35 | Atlanta, GA: I-20 at I-75/I-85 | GA | 39.8 | 30.7 | 43.0 | -3.0% |
| 36 | Denver, CO: I-25 at I-76 | CO | 46.1 | 36.7 | 50.0 | -1.6% |
| 37 | Norwalk, CT: I-95 | CT | 41.3 | 35.6 | 42.8 | -2.6% |
| 38 | Brooklyn, NY: I-278 at Belt Parkway | NY | 40.4 | 30.9 | 44.2 | 1.7% |
| 39 | Denver, CO: I-270 | CO | 38.6 | 29.3 | 42.9 | 3.0% |
| 40 | Providence, RI: I-95 at I-195 | RI | 40.1 | 33.2 | 43.1 | -1.6% |
| 41 | Detroit, MI: I-94 at I-75 | MI | 45.3 | 40.4 | 47.6 | -6.9% |
| 42 | Corona, CA: I-15 at SR 91 | CA | 45.0 | 38.7 | 47.4 | -7.3% |
| 43 | Queens, NY: I-495 | NY | 25.5 | 15.6 | 30.7 | 1.7% |
| 44 | Denver, CO: I-70 at I-270 | CO | 45.1 | 37.3 | 48.6 | -0.9% |
| 45 | Oakland, CA: I-880 at I-238 | CA | 40.9 | 33.0 | 44.8 | -3.7% |
| 46 | Houston, TX: I-610 at US 290 | TX | 42.8 | 31.8 | 48.3 | 3.1% |
| 47 | Chattanooga, TN: I-24 at US 27 | TN | 46.9 | 39.7 | 50.1 | -0.9% |
| 48 | Seattle, WA: I-5 at I-90 | WA | 34.7 | 27.3 | 38.1 | -0.4% |
| 49 | St. Louis, MO: I-64/I-55 at I-44 | MO | 47.0 | 44.2 | 48.0 | -1.6% |
| 50 | Bronx, NY: I-678 | NY | 29.7 | 27.4 | 30.6 | 8.2% |
| 51 | Boston, MA: I-93 at SR 3 | MA | 34.3 | 24.7 | 41.3 | -15.6% |
| 52 | Camden, NJ: I-76 at I-676 | NJ | 44.1 | 40.7 | 45.3 | -6.4% |
| 53 | Charlotte, NC: I-77 near Lake Norman | NC | 40.3 | 29.6 | 47.7 | -11.7% |
| 54 | Austin, TX: I-35 | TX | 35.3 | 23.7 | 38.9 | -5.2% |
| 55 | Indianapolis, IN: I-465 at I-69 | IN | 47.1 | 40.4 | 49.8 | -8.5% |
| 56 | Minneapolis – St. Paul, MN: I-35W at I-494 | MN | 46.7 | 39.5 | 49.8 | -3.5% |
| 57 | Houston, TX: I-10 at I-610 (East) | TX | 49.3 | 42.9 | 52.0 | -1.1% |
| 58 | Auburn, WA: SR 18 at SR 167 | WA | 43.7 | 33.2 | 49.7 | -15.1% |
| 59 | Charlotte, NC: I-77 at I-485 (South) | NC | 50.7 | 43.1 | 54.1 | -4.7% |
| 60 | Los Angeles, CA: I-110 at I-105 | CA | 39.1 | 30.1 | 43.3 | -4.8% |
| 61 | Chattanooga, TN: I-75 at I-24 | TN | 51.6 | 49.7 | 52.3 | -3.0% |
| 62 | Dallas, TX: US 75 at I-635 | TX | 44.3 | 34.9 | 48.2 | -6.6% |
| 63 | Philadelphia, PA: I-476 at I-95 | PA | 43.8 | 37.5 | 46.4 | -3.3% |
| 64 | Philadelphia, PA: I-76 at US 1 | PA | 34.3 | 25.5 | 38.3 | 0.7% |
| 65 | Nashville, TN: I-65 at I-24 | TN | 46.6 | 38.3 | 50.0 | -5.9% |
| 66 | Waterbury, CT: I-84 at SR 8 | CT | 45.7 | 47.0 | 45.3 | -1.6% |
| 67 | Charlotte, NC: I-85 at I-485 (West) | NC | 49.7 | 42.3 | 53.2 | -5.9% |
| 68 | Ft. Worth, TX: I-35W at I-30 | TX | 44.5 | 34.7 | 48.7 | -7.0% |
| 69 | Knoxville, TN: I-40/I-75 at I-140 | TN | 48.9 | 40.1 | 53.9 | -2.6% |
| 70 | Las Vegas, NV: I-15 at I-515 | NV | 47.6 | 40.4 | 51.3 | -3.1% |
| 71 | Boston, MA: I-95 at I-90 | MA | 45.5 | 37.5 | 49.1 | -7.7% |
| 72 | Atlanta, GA: I-75 at I-85 | GA | 39.4 | 28.1 | 43.5 | -4.2% |
| 73 | Indianapolis, IN: I-65 at I-70 (South) | IN | 47.7 | 41.2 | 50.6 | -3.1% |
| 74 | Knoxville , TN: I-40 at I-275 | TN | 49.3 | 42.1 | 52.7 | -2.6% |
| 75 | Federal Way, WA: SR 18 at I-5 | WA | 47.3 | 40.0 | 50.8 | -0.3% |
| 76 | Washington, DC: I-495 at I-66 | DC | 44.2 | 34.5 | 48.1 | -15.8% |
| 77 | Washington, DC: I-95 at I-495 (North) | DC | 46.3 | 36.5 | 50.6 | -4.2% |
| 78 | Bellmawr, NJ: I-295 at I-76 | NJ | 44.7 | 39.6 | 46.8 | -6.5% |
| 79 | Greenville, SC: I-85 at I-385 | SC | 51.0 | 43.1 | 54.6 | -4.0% |
| 80 | Tampa, FL: I-4 at I-275 | FL | 38.4 | 29.1 | 42.8 | -6.7% |
| 81 | Charleston, SC: I-26 at I-526 | SC | 41.4 | 31.9 | 46.0 | -2.6% |
| 82 | Tiger Mountain Summit, WA: SR 18 | WA | 32.9 | 29.2 | 34.7 | -14.0% |
| 83 | Houston, TX: I-10 at I-69/US 59 | TX | 45.3 | 33.1 | 51.7 | -6.7% |
| 84 | Seattle, WA: I-90 at I-405 | WA | 39.3 | 31.5 | 43.1 | -2.3% |
| 85 | Washington, DC: I-495 at I-270 (West) | DC | 43.8 | 33.5 | 47.9 | -7.0% |
| 86 | Phoenix, AZ: I-17 at I-10 | AZ | 47.5 | 39.3 | 51.1 | -3.3% |
| 87 | Los Angeles, CA: SR 91 at SR 55 | CA | 46.4 | 39.0 | 49.1 | -3.6% |
| 88 | Houston, TX: I-610 at I-69/US 59 (West) | TX | 40.3 | 29.3 | 44.5 | -7.2% |
| 89 | New Haven, CT: I-95 at I-91 | CT | 48.1 | 38.3 | 51.7 | -1.2% |
| 90 | Manhasset, NY: I-495 at Shelter Rock Road | NY | 43.1 | 34.7 | 46.3 | 2.1% |
| 91 | Nyack, NY: I-287 | NY | 47.9 | 39.1 | 51.4 | -2.6% |
| 92 | Atlanta, GA: I-75 at I-675 | GA | 49.9 | 53.8 | 48.7 | 1.1% |
| 93 | Houston, TX: I-45 at Sam Houston Tollway (North) | TX | 49.0 | 40.8 | 52.2 | -3.4% |
| 94 | Boston, MA: I-95 at I-93 (North) | MA | 43.4 | 35.4 | 47.3 | -6.7% |
| 95 | Milwaukee, WI: I-94/I-794 at I-43 | WI | 44.8 | 36.6 | 49.1 | -5.4% |
| 96 | Oakland, CA: I-80 at I-580/I-880 | CA | 34.9 | 27.2 | 38.3 | -6.1% |
| 97 | Baltimore, MD: I-695 at I-70 | MD | 48.8 | 43.6 | 50.9 | -0.3% |
| 98 | Washington, D.C.: I-95/I-495 (South Side) | DC | 48.1 | 38.1 | 52.6 | -6.8% |
| 99 | Kansas City, MO: I-70/I-670 at US 71 | MO | 47.8 | 43.7 | 49.6 | 0.7% |
| 100 | Norfolk, VA: I-264 at I-464 | VA | 33.6 | 27.5 | 36.9 | -6.3% |